SARS-CoV-2 Drug Repositioning Manuscript Supplementary Materials

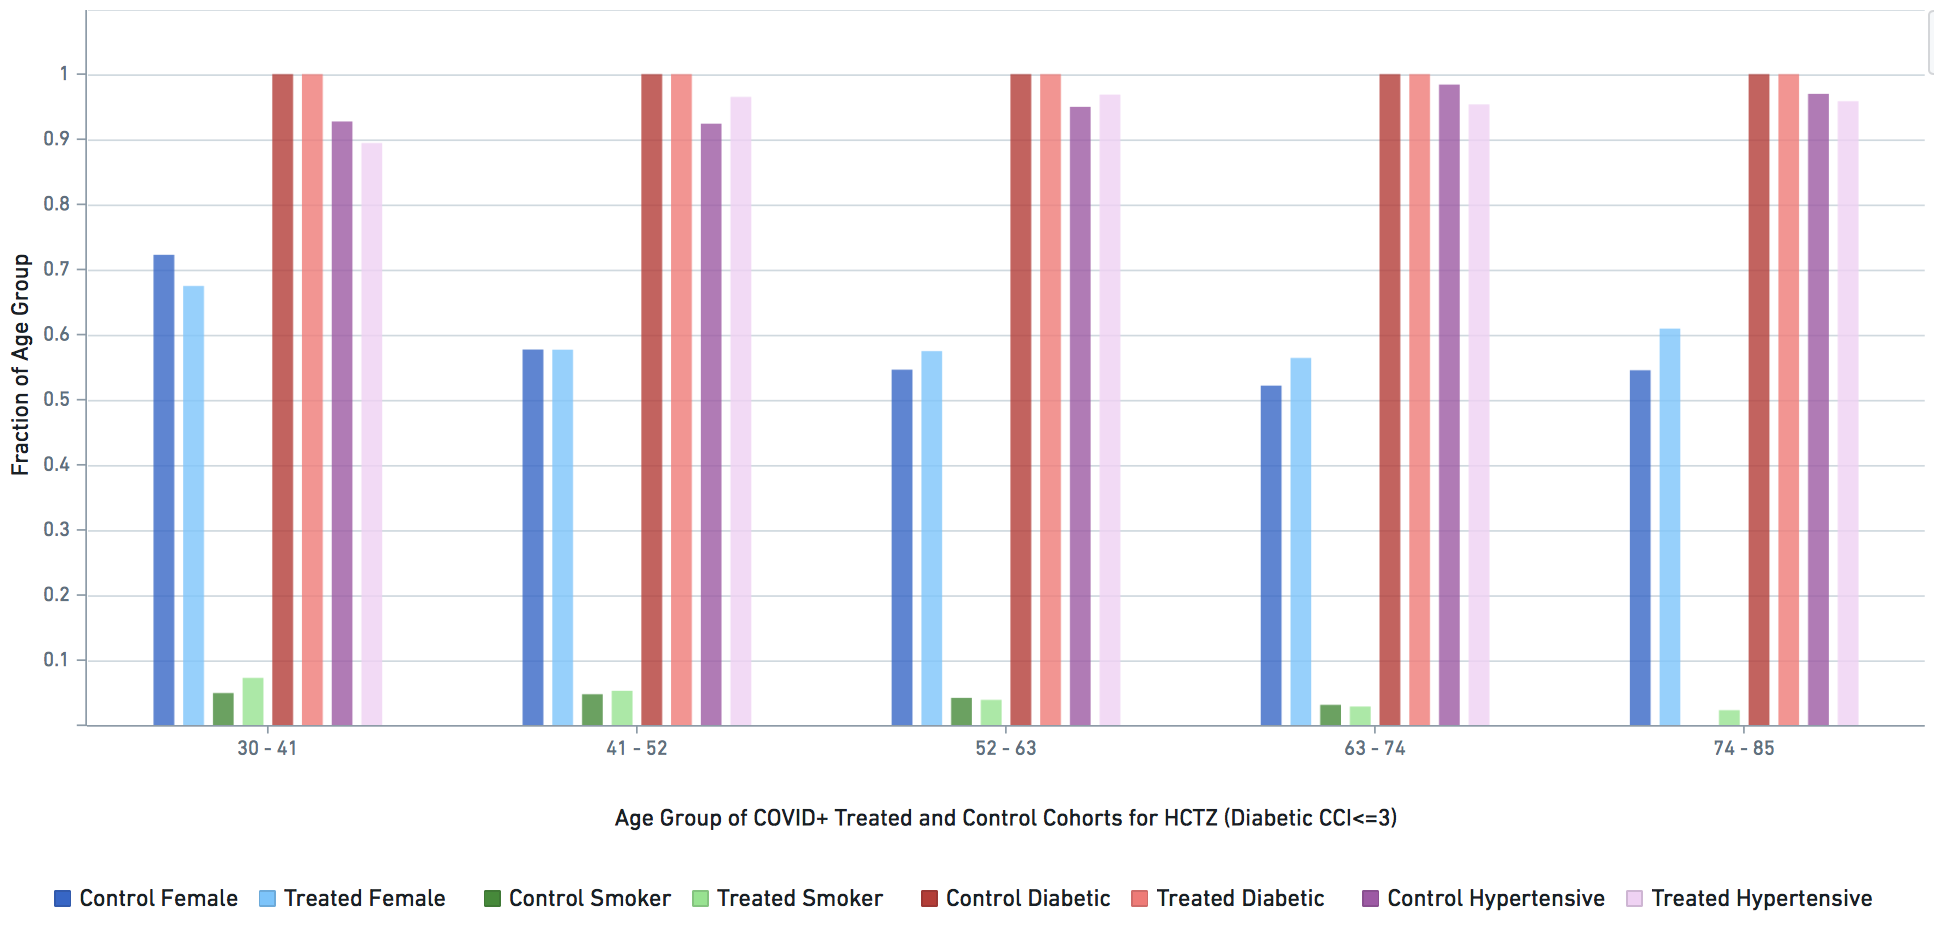
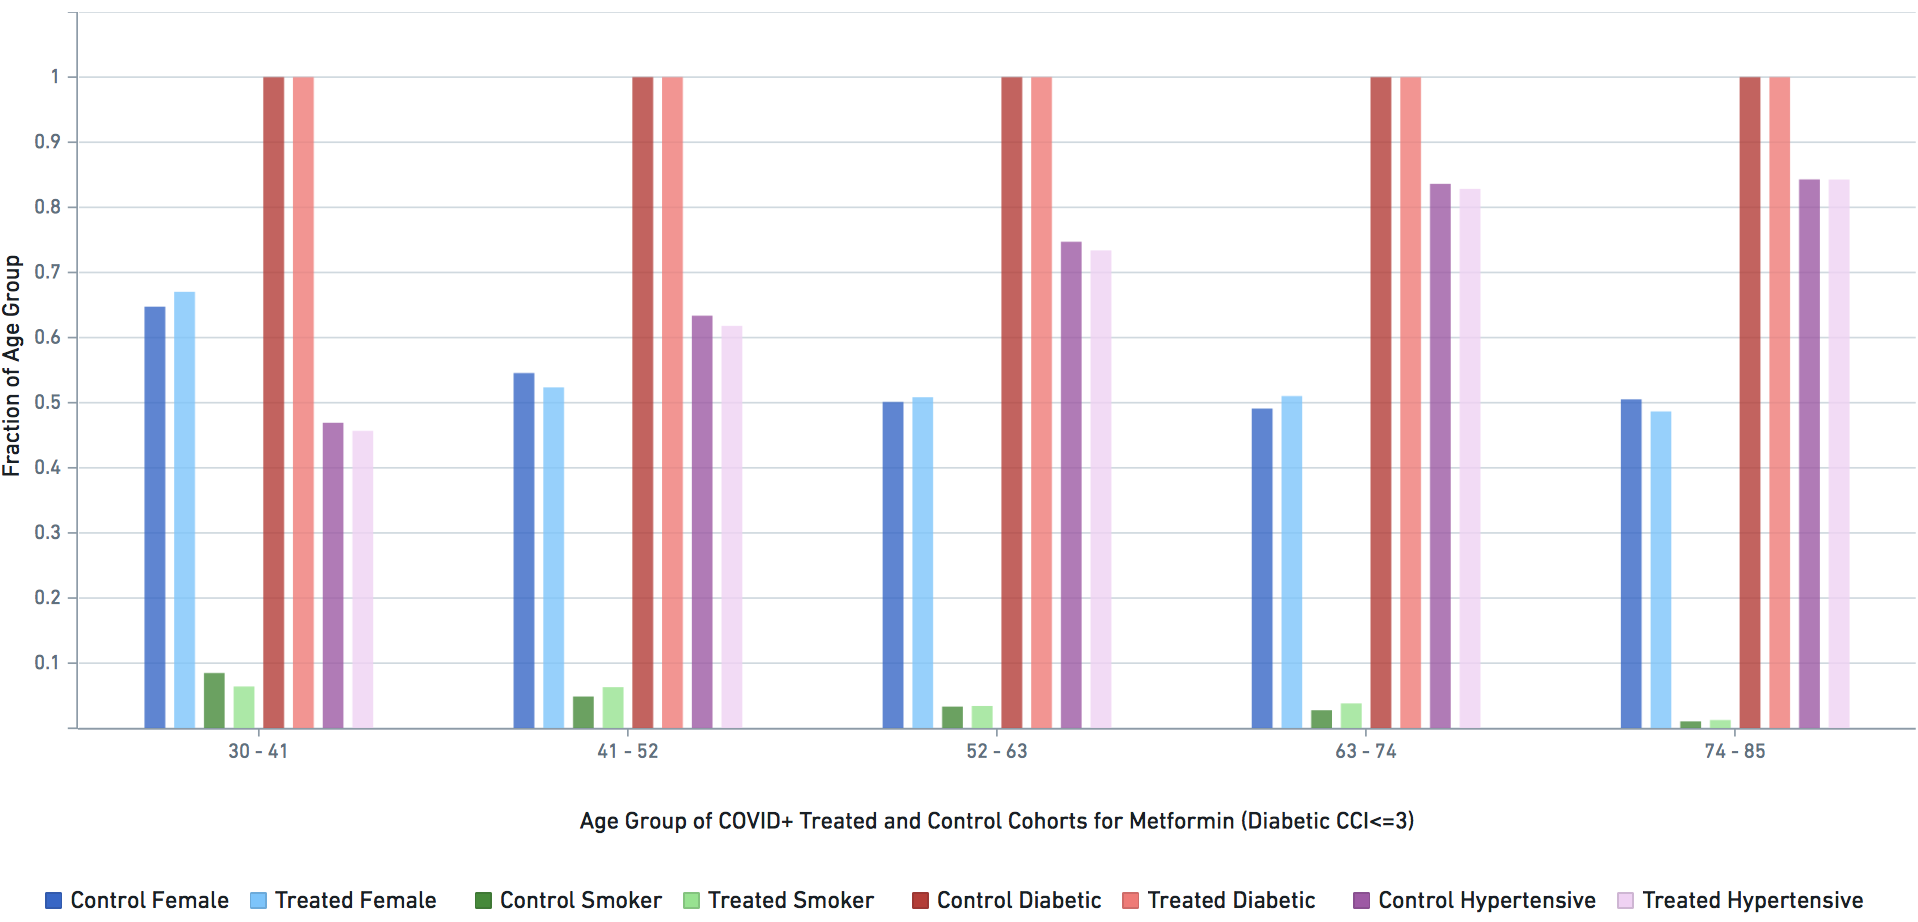
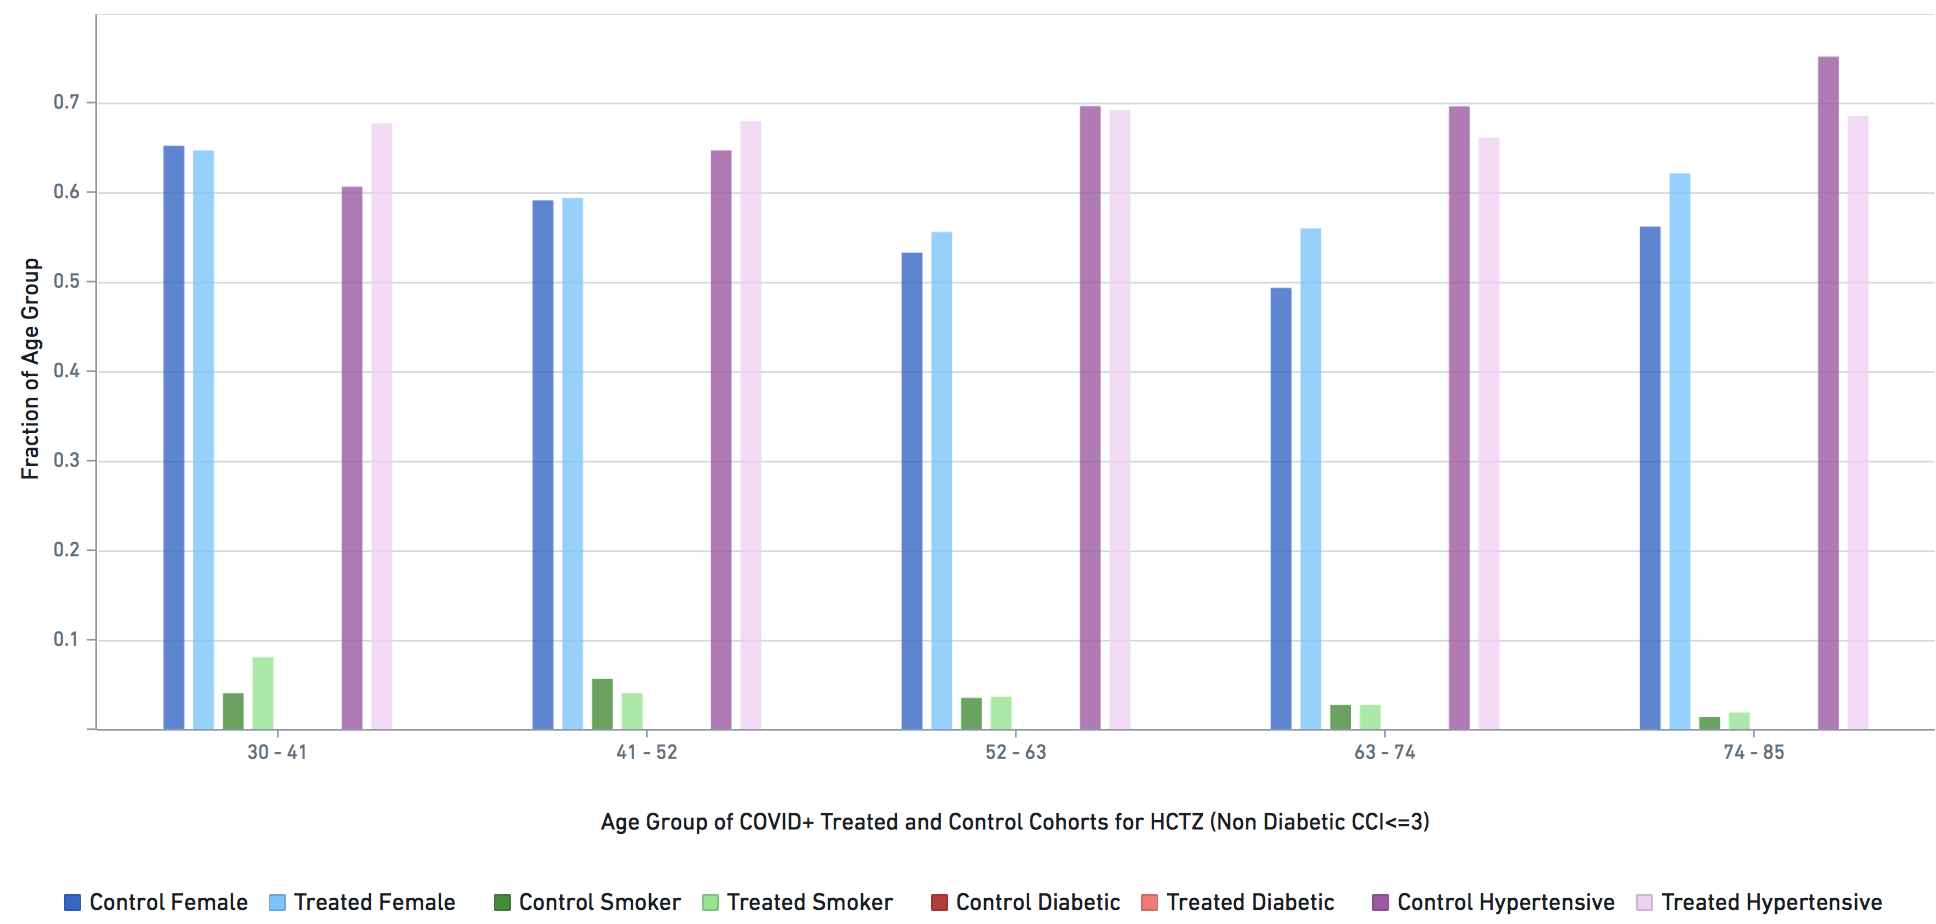
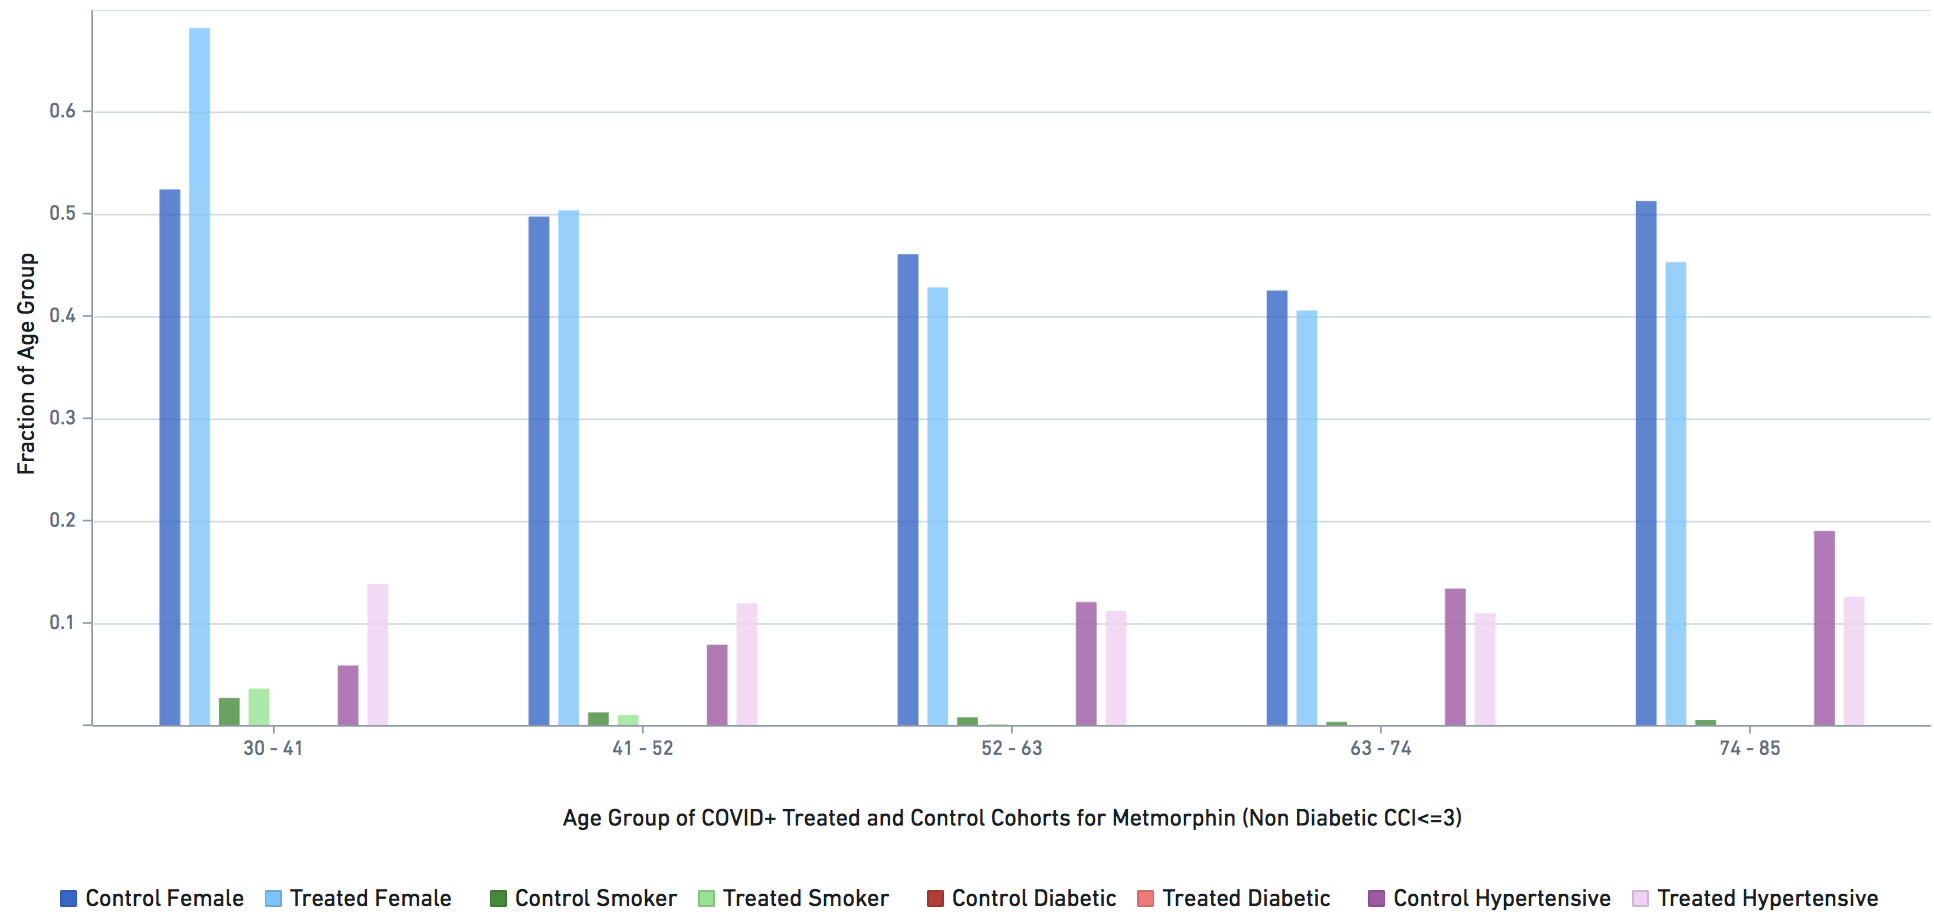
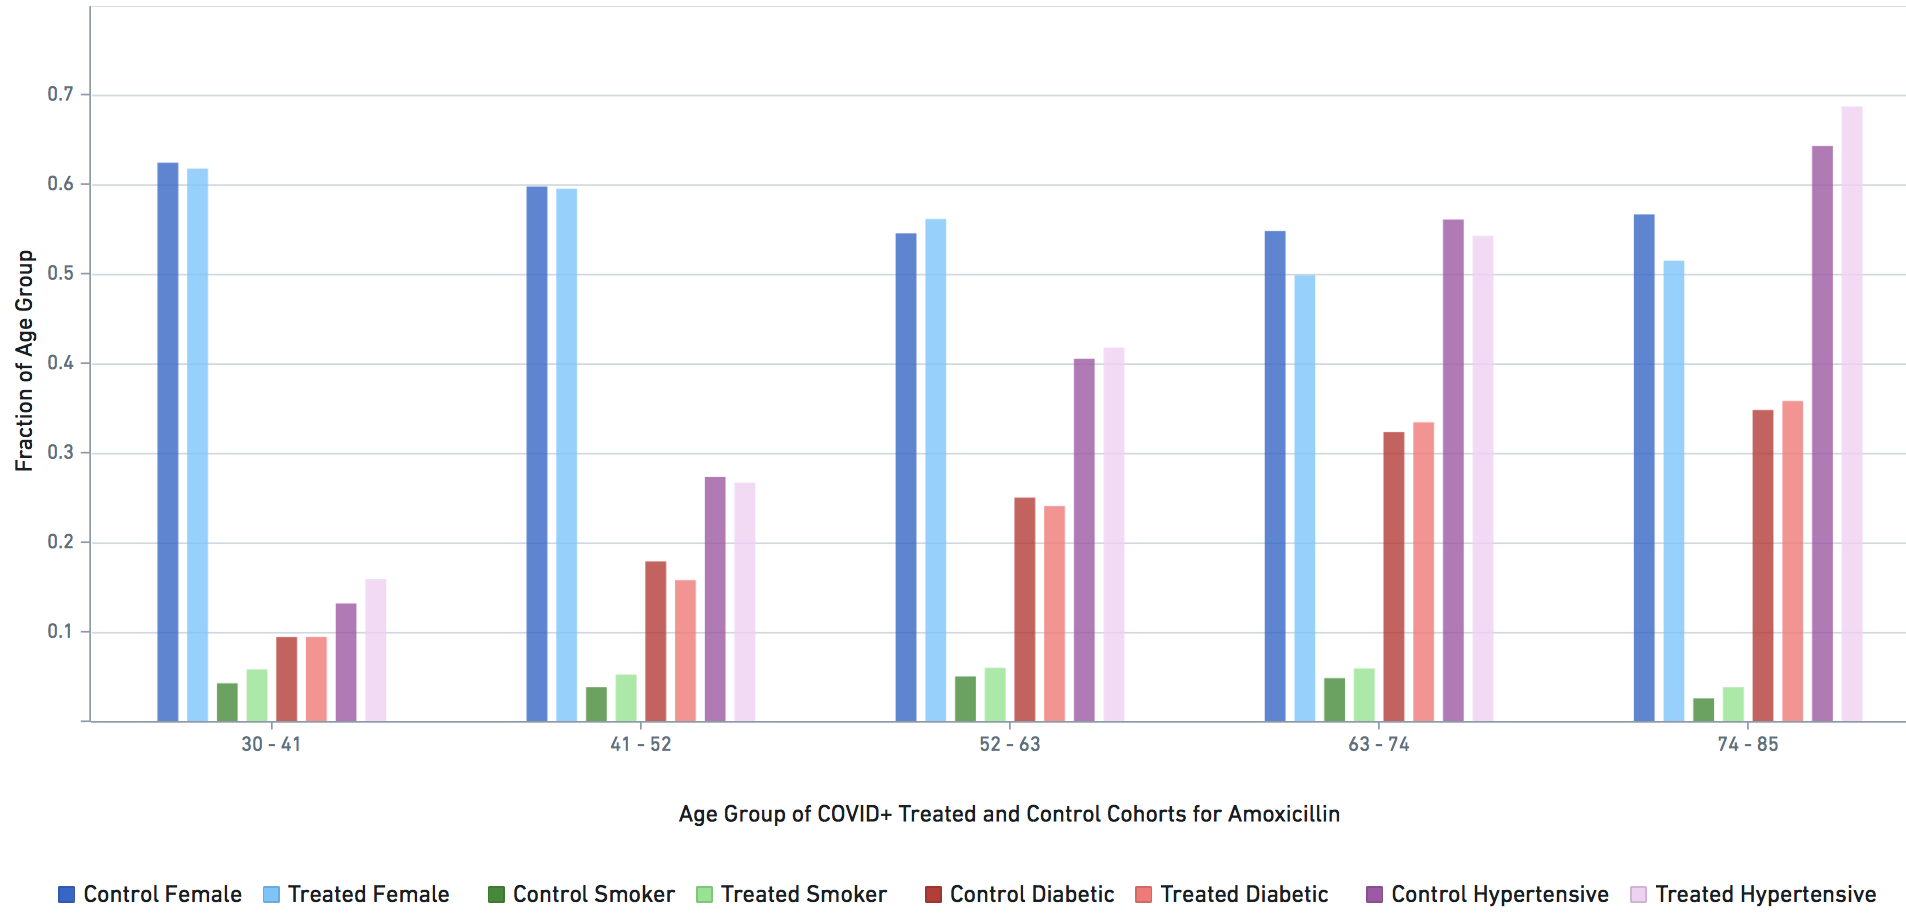
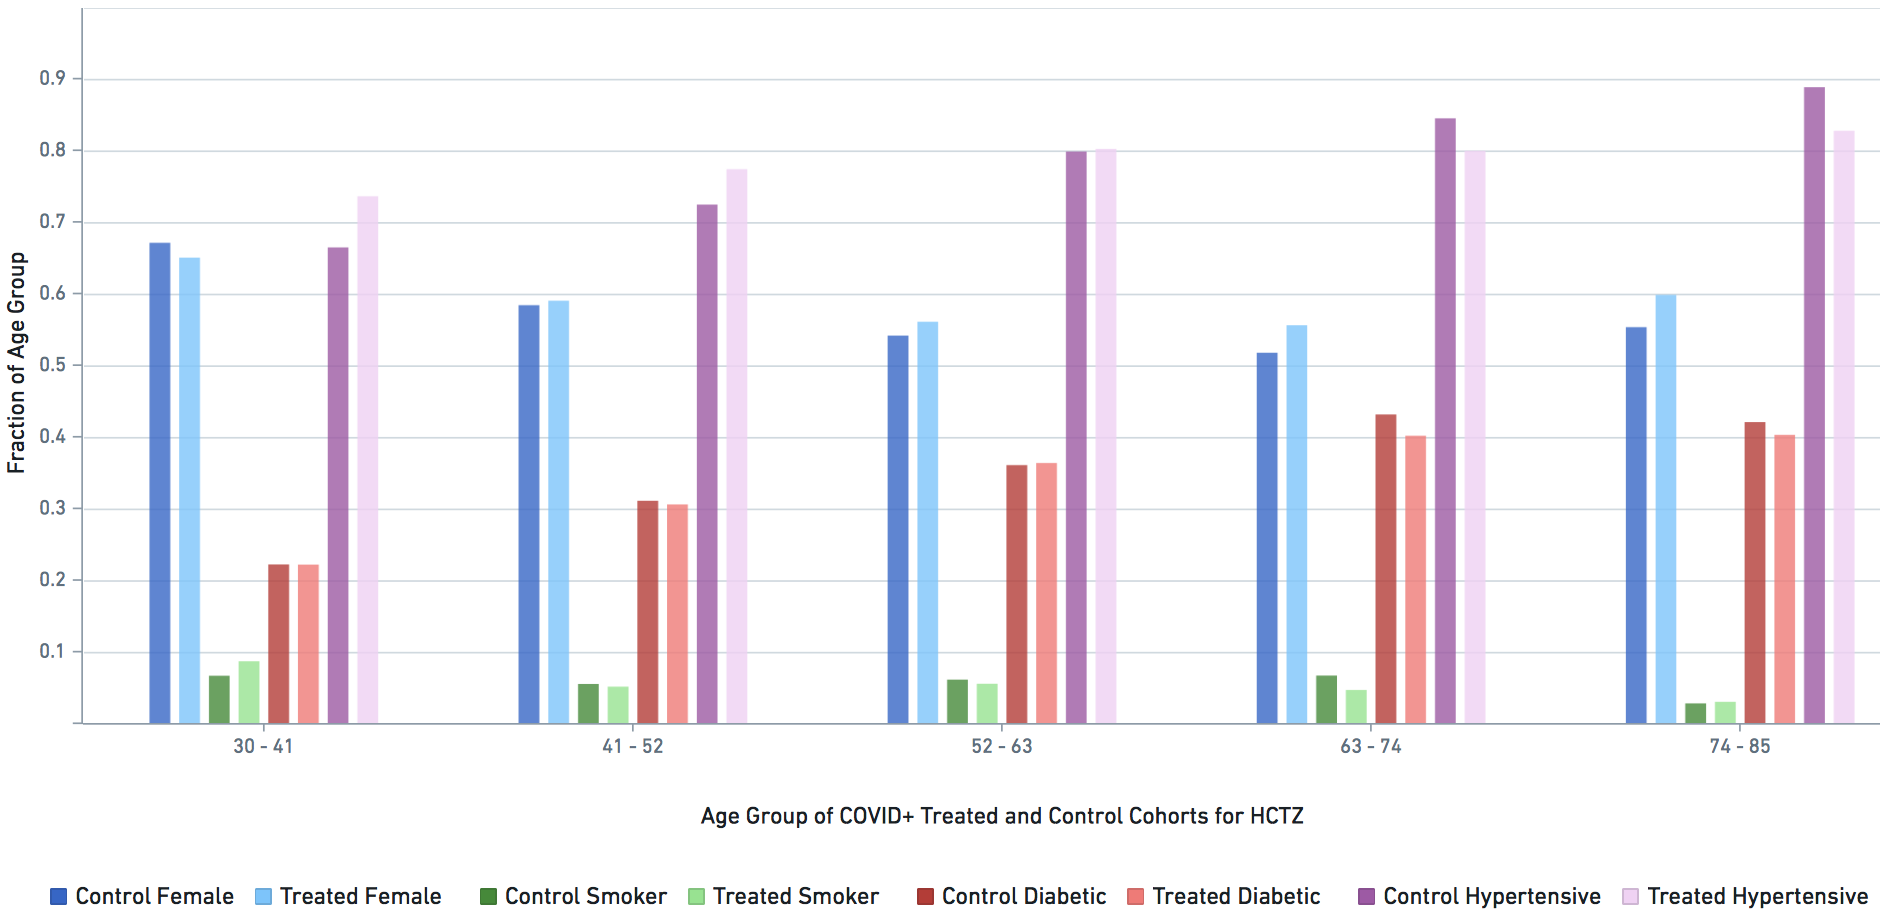
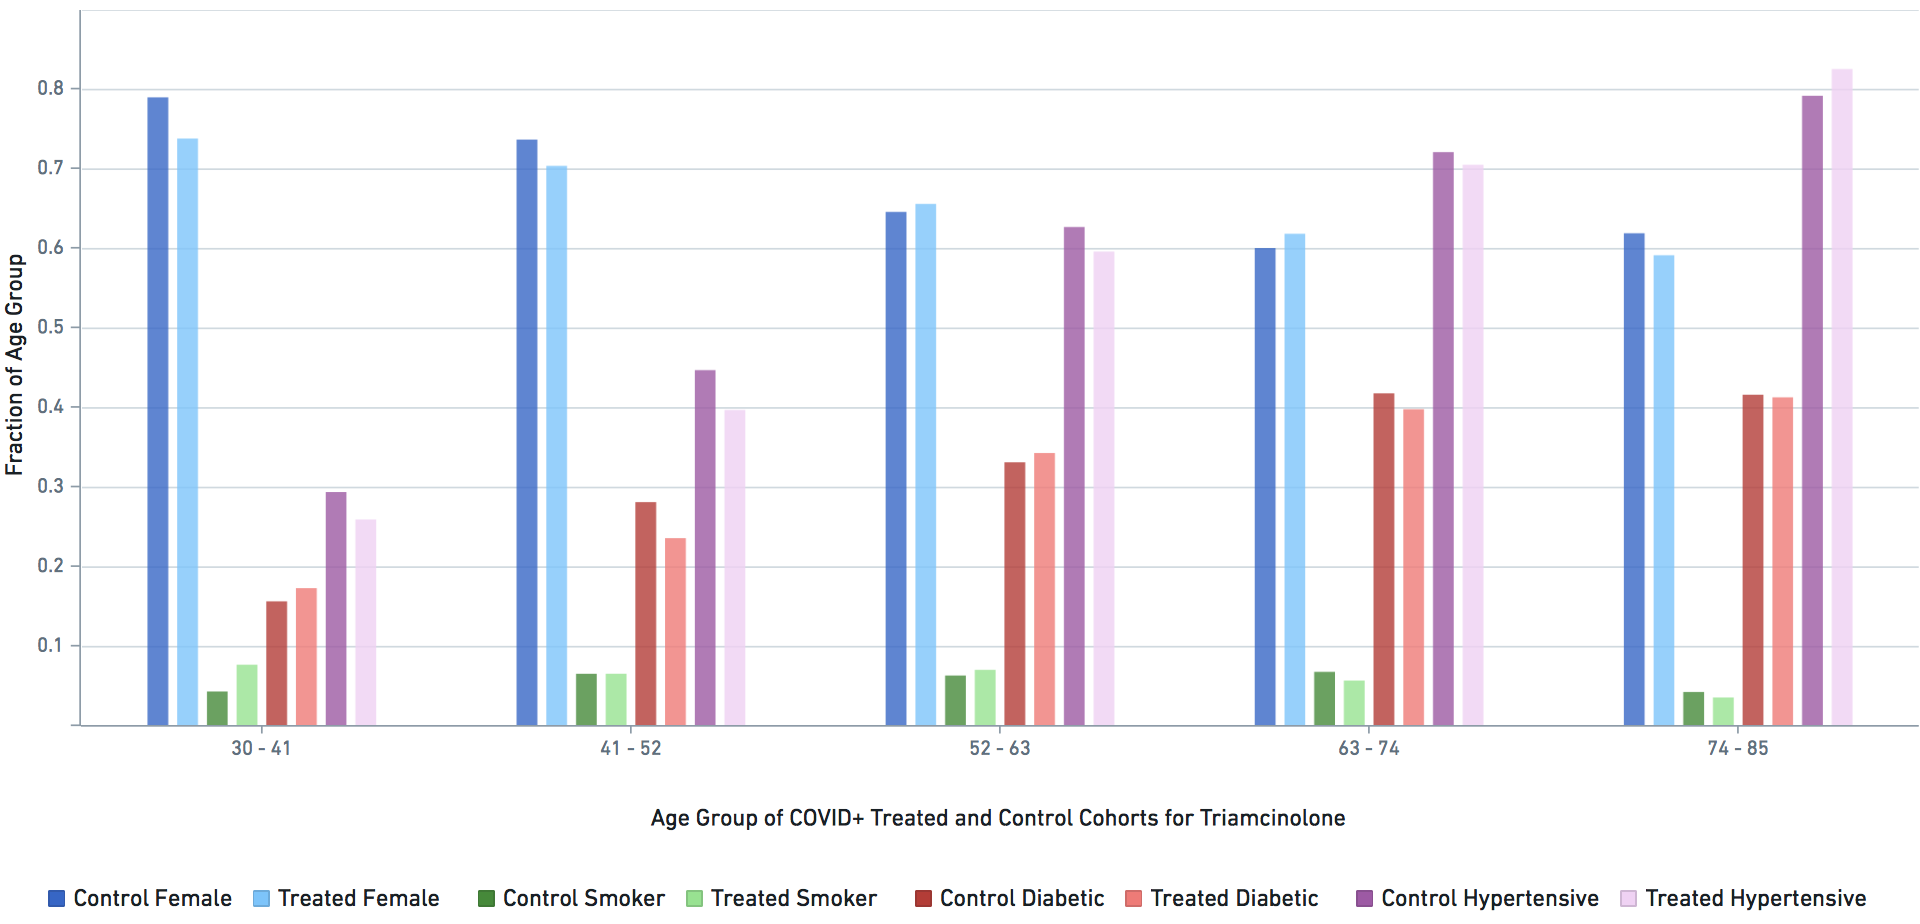
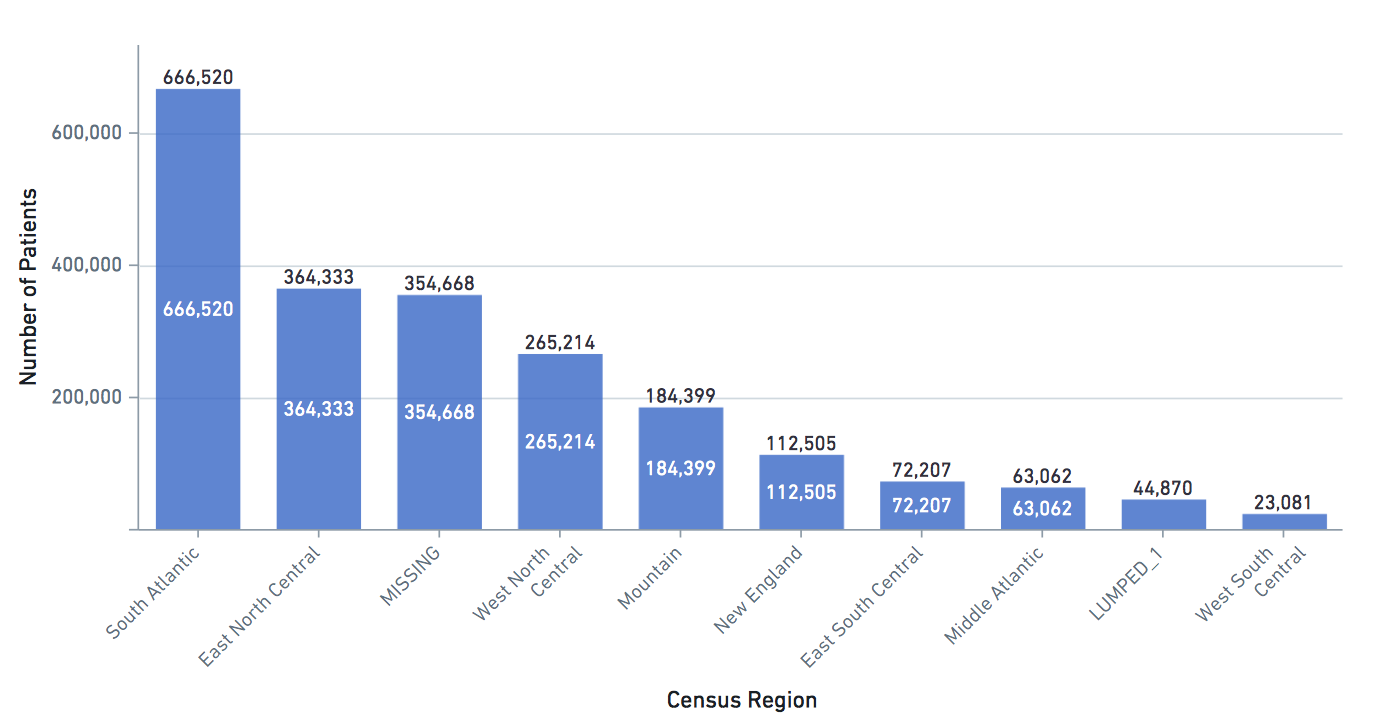
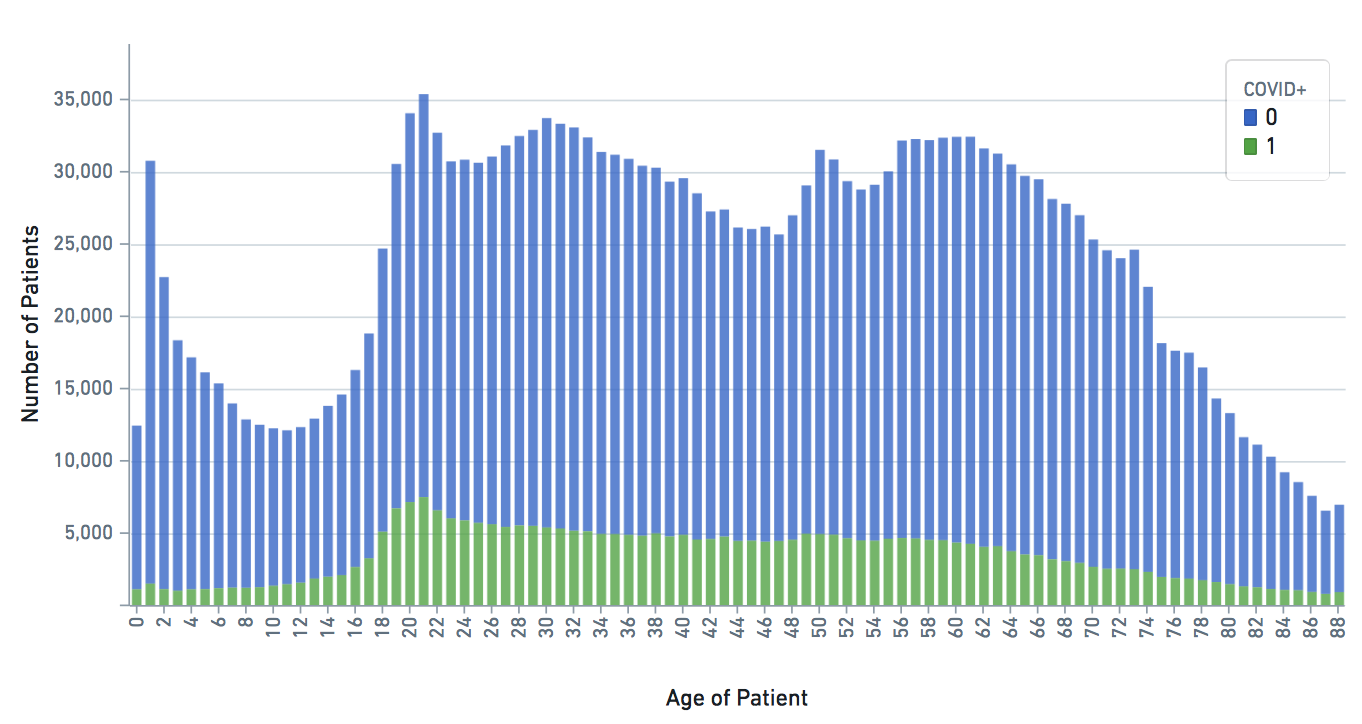
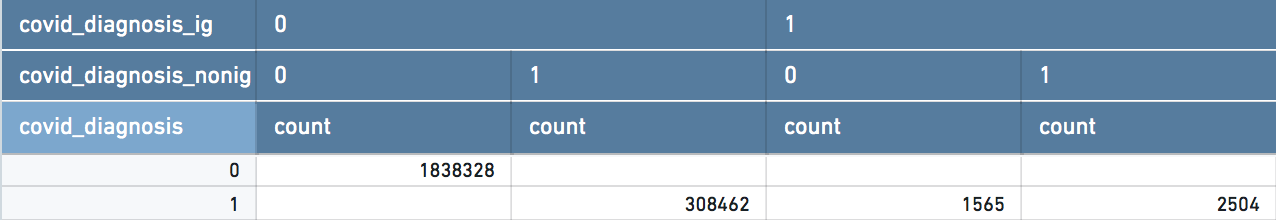
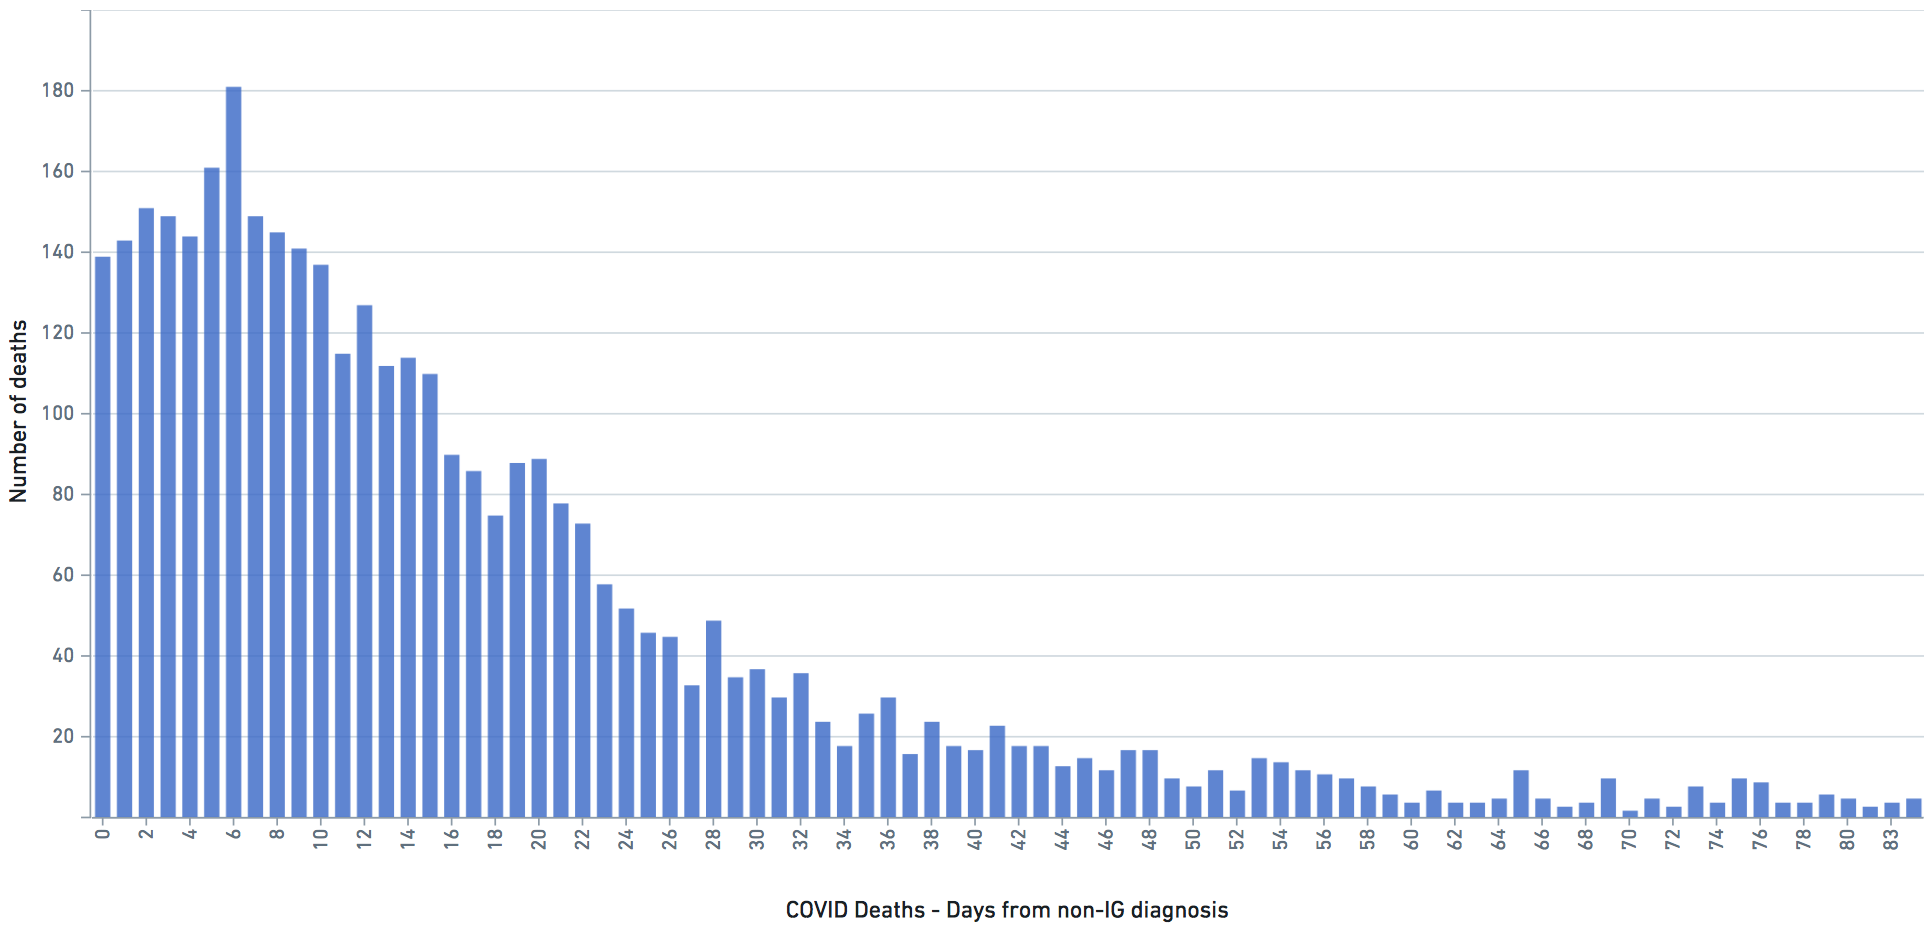
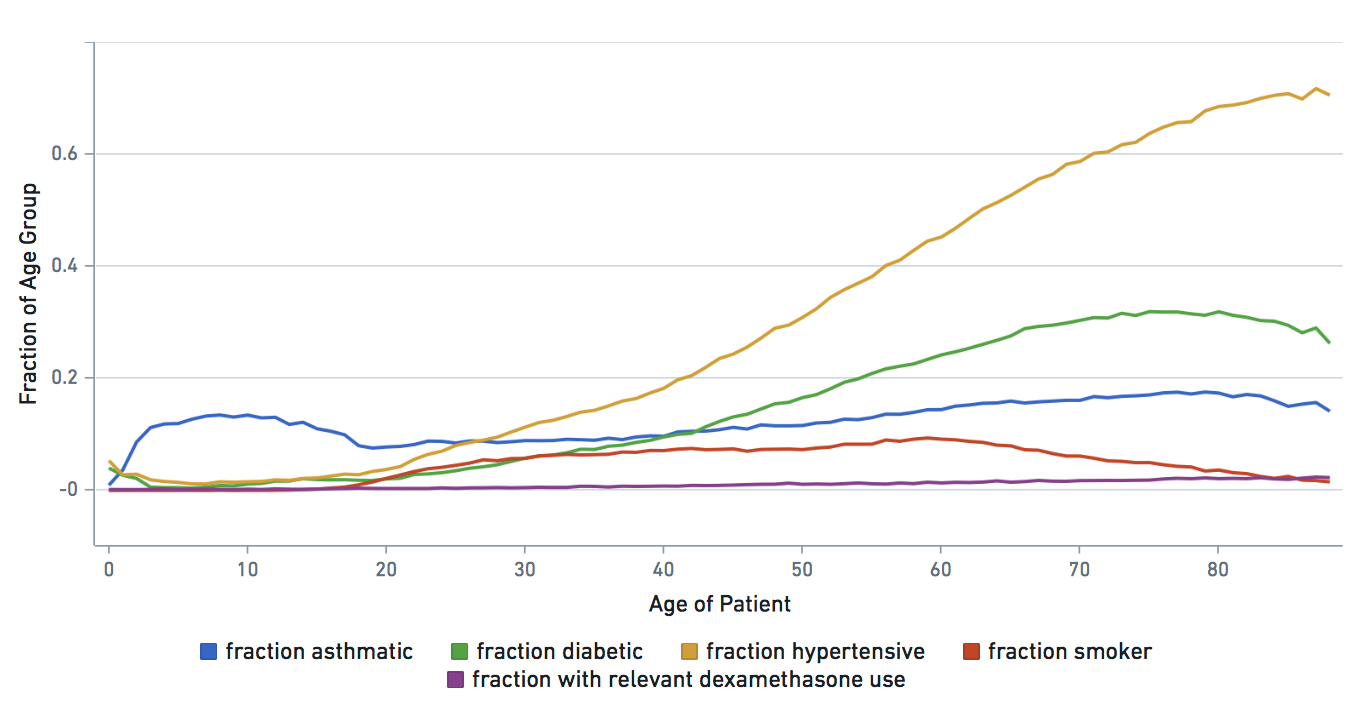
Applicable demographic/clinical distribution information based on 12-07-2020 N3C Data Release (Release v15). Supplementary materials of manuscript (pre-print).

Supplementary Data Image
Figure S1: Gender, Smoker, Diabetes (all diabetic), Hypertension distribution across age groups (as fraction of age group) for treated (with HCTZ) and matched control cohorts across Charlson Comorbidity Index (CCI) <= 3 used for statistically significant clinical effect analysis. The darker shade of each colored pair is Control (untreated), while the lighter shade is Treated (with Metformin). For example, the dark purple (control cohort) and light purple (treated cohort) bars on each age group represent the fraction of patients in those age groups that are hypertensive.
Supplementary Data Image
Figure S2: Gender, Smoker, Diabetes (all diabetic), Hypertension distribution across age groups (as fraction of age group) for treated (with Metformin) and matched control cohorts across Charlson Comorbidity Index (CCI) <= 3 used for statistically significant clinical effect analysis. The darker shade of each colored pair is Control (untreated), while the lighter shade is Treated (with Metformin). For example, the dark purple (control cohort) and light purple (treated cohort) bars on each age group represent the fraction of patients in those age groups that are hypertensive.
Supplementary Data Image
Figure S3: Gender, Smoker, Diabetes (all non-diabetic), Hypertension distribution across age groups (as fraction of age group) for treated (with HCTZ) and matched control cohorts across Charlson Comorbidity Index (CCI) <= 3 used for statistically significant clinical effect analysis. The darker shade of each colored pair is Control (untreated), while the lighter shade is Treated (with Metformin). For example, the dark purple (control cohort) and light purple (treated cohort) bars on each age group represent the fraction of patients in those age groups that are hypertensive.
Supplementary Data Image
Figure S4: Gender, Smoker, Diabetes (all non-diabetic), Hypertension distribution across age groups (as fraction of age group) for treated (with Metformin) and matched control cohorts across Charlson Comorbidity Index (CCI) <= 3 used for statistically significant clinical effect analysis. The darker shade of each colored pair is Control (untreated), while the lighter shade is Treated (with Metformin). For example, the dark purple (control cohort) and light purple (treated cohort) bars on each age group represent the fraction of patients in those age groups that are hypertensive.
Supplementary Data Image
Figure S4: Gender, Smoker, Diabetes, Hypertension distribution across age groups (as fraction of age group) for treated (with Amoxicillin) and matched control cohorts across all Charlson Comorbidity Index (CCI) used for statistically significant clinical effect analysis. The darker shade of each colored pair is Control (untreated), while the lighter shade is Treated (with Metformin). For example, the dark purple (control cohort) and light purple (treated cohort) bars on each age group represent the fraction of patients in those age groups that are hypertensive.
Supplementary Data Image
Figure S5: Gender, Smoker, Diabetes, Hypertension distribution across age groups (as fraction of age group) for treated (with HCTZ) and matched control cohorts across all Charlson Comorbidity Index (CCI) used for statistically significant clinical effect analysis. The darker shade of each colored pair is Control (untreated), while the lighter shade is Treated (with HCTZ). For example, the dark purple (control cohort) and light purple (treated cohort) bars on each age group represent the fraction of patients in those age groups that are hypertensive.
Supplementary Data Image
Figure S6: Gender, Smoker, Diabetes, Hypertension distribution across age groups (as fraction of age group) for treated (with Triamcinolone) and matched control cohorts across all Charlson Comorbidity Index (CCI) used for statistically significant clinical effect analysis. The darker shade of each colored pair is Control (untreated), while the lighter shade is Treated (with Triamcinolone). For example, the dark purple (control cohort) and light purple (treated cohort) bars on each age group represent the fraction of patients in those age groups that are hypertensive.
Supplementary Data Image
Figure S7: CCI distribution by age group in dataset
Supplementary Data Image
Figure S7: Census region distribution in dataset
Supplementary Data Image
Figure S8: COVID+ by age group in data set
Supplementary Data Image
Figure S9: COVID+ total incidence
Supplementary Data Image
Figure S10: COVID+ death distribution as calculated from number of days from COVID+ diagnosis
Supplementary Data Image
Figure S11: Compound to protein interaction score distribution (not based on N3C patient data).
Supplementary Data Image
Figure S12: Predictor incidence by age group of certain key predictors used for cohort statistical analysis cohort matching
Supplementary Data Image
Figure S13: Nicotine Receptor to Nicotine (positive control) and Albuterol (negative control) Quasi-Quantum simulation invocations
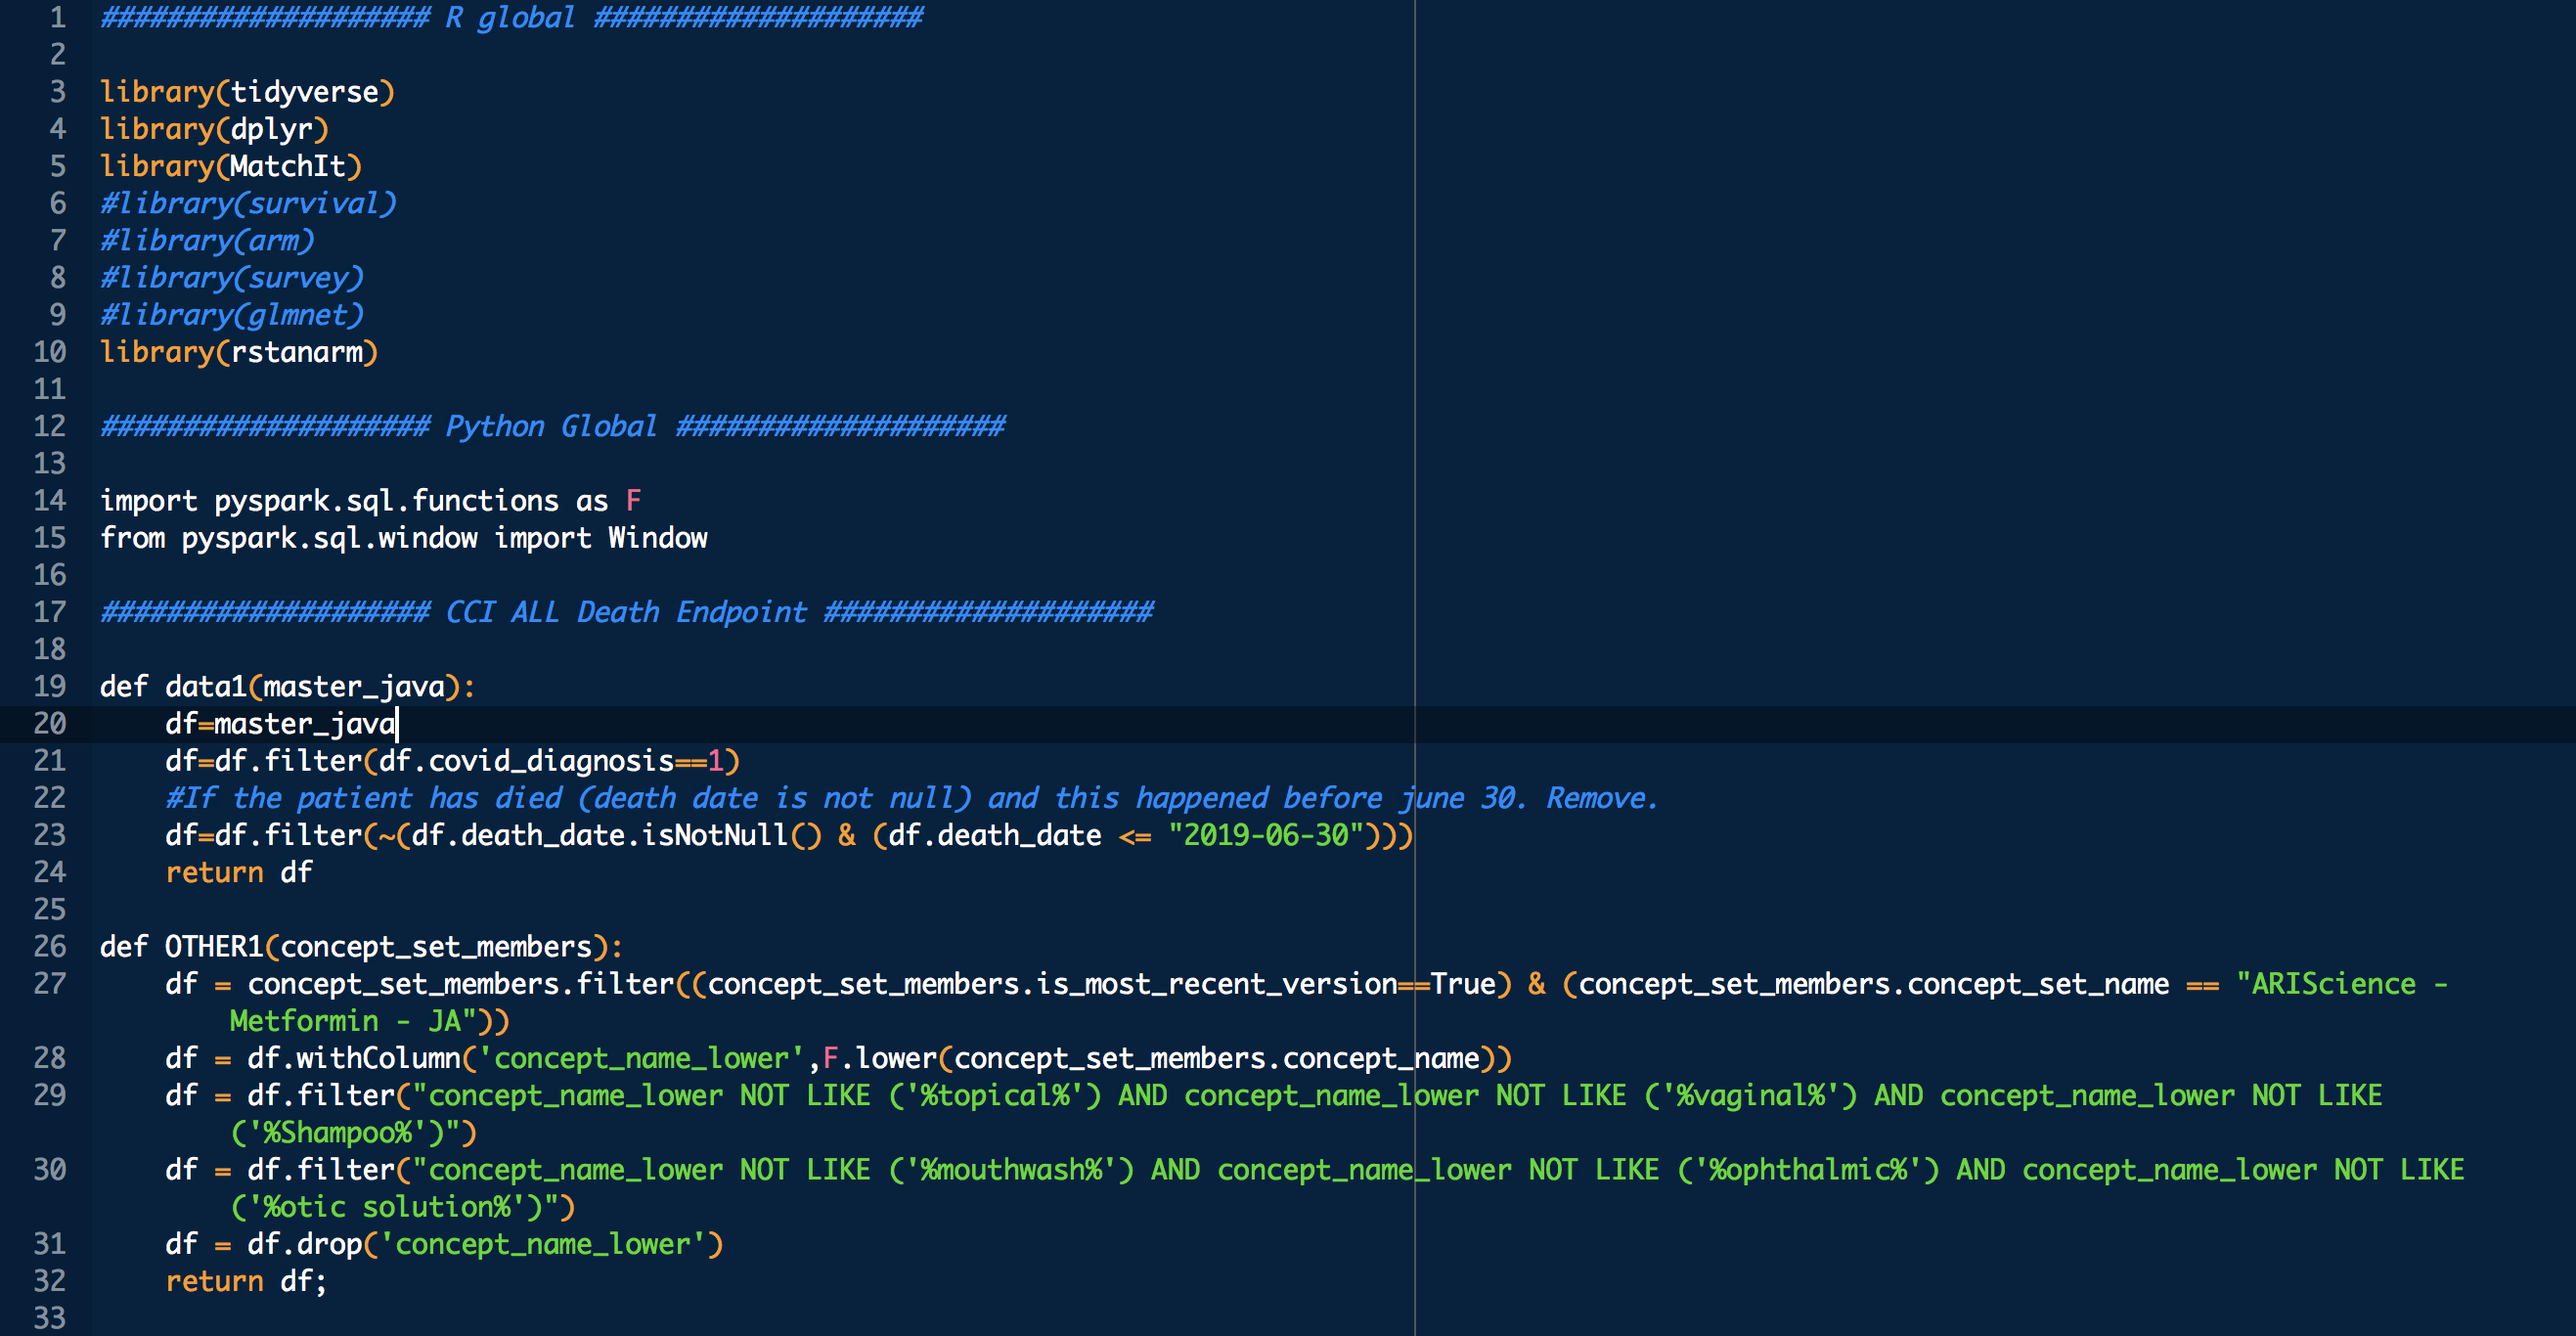
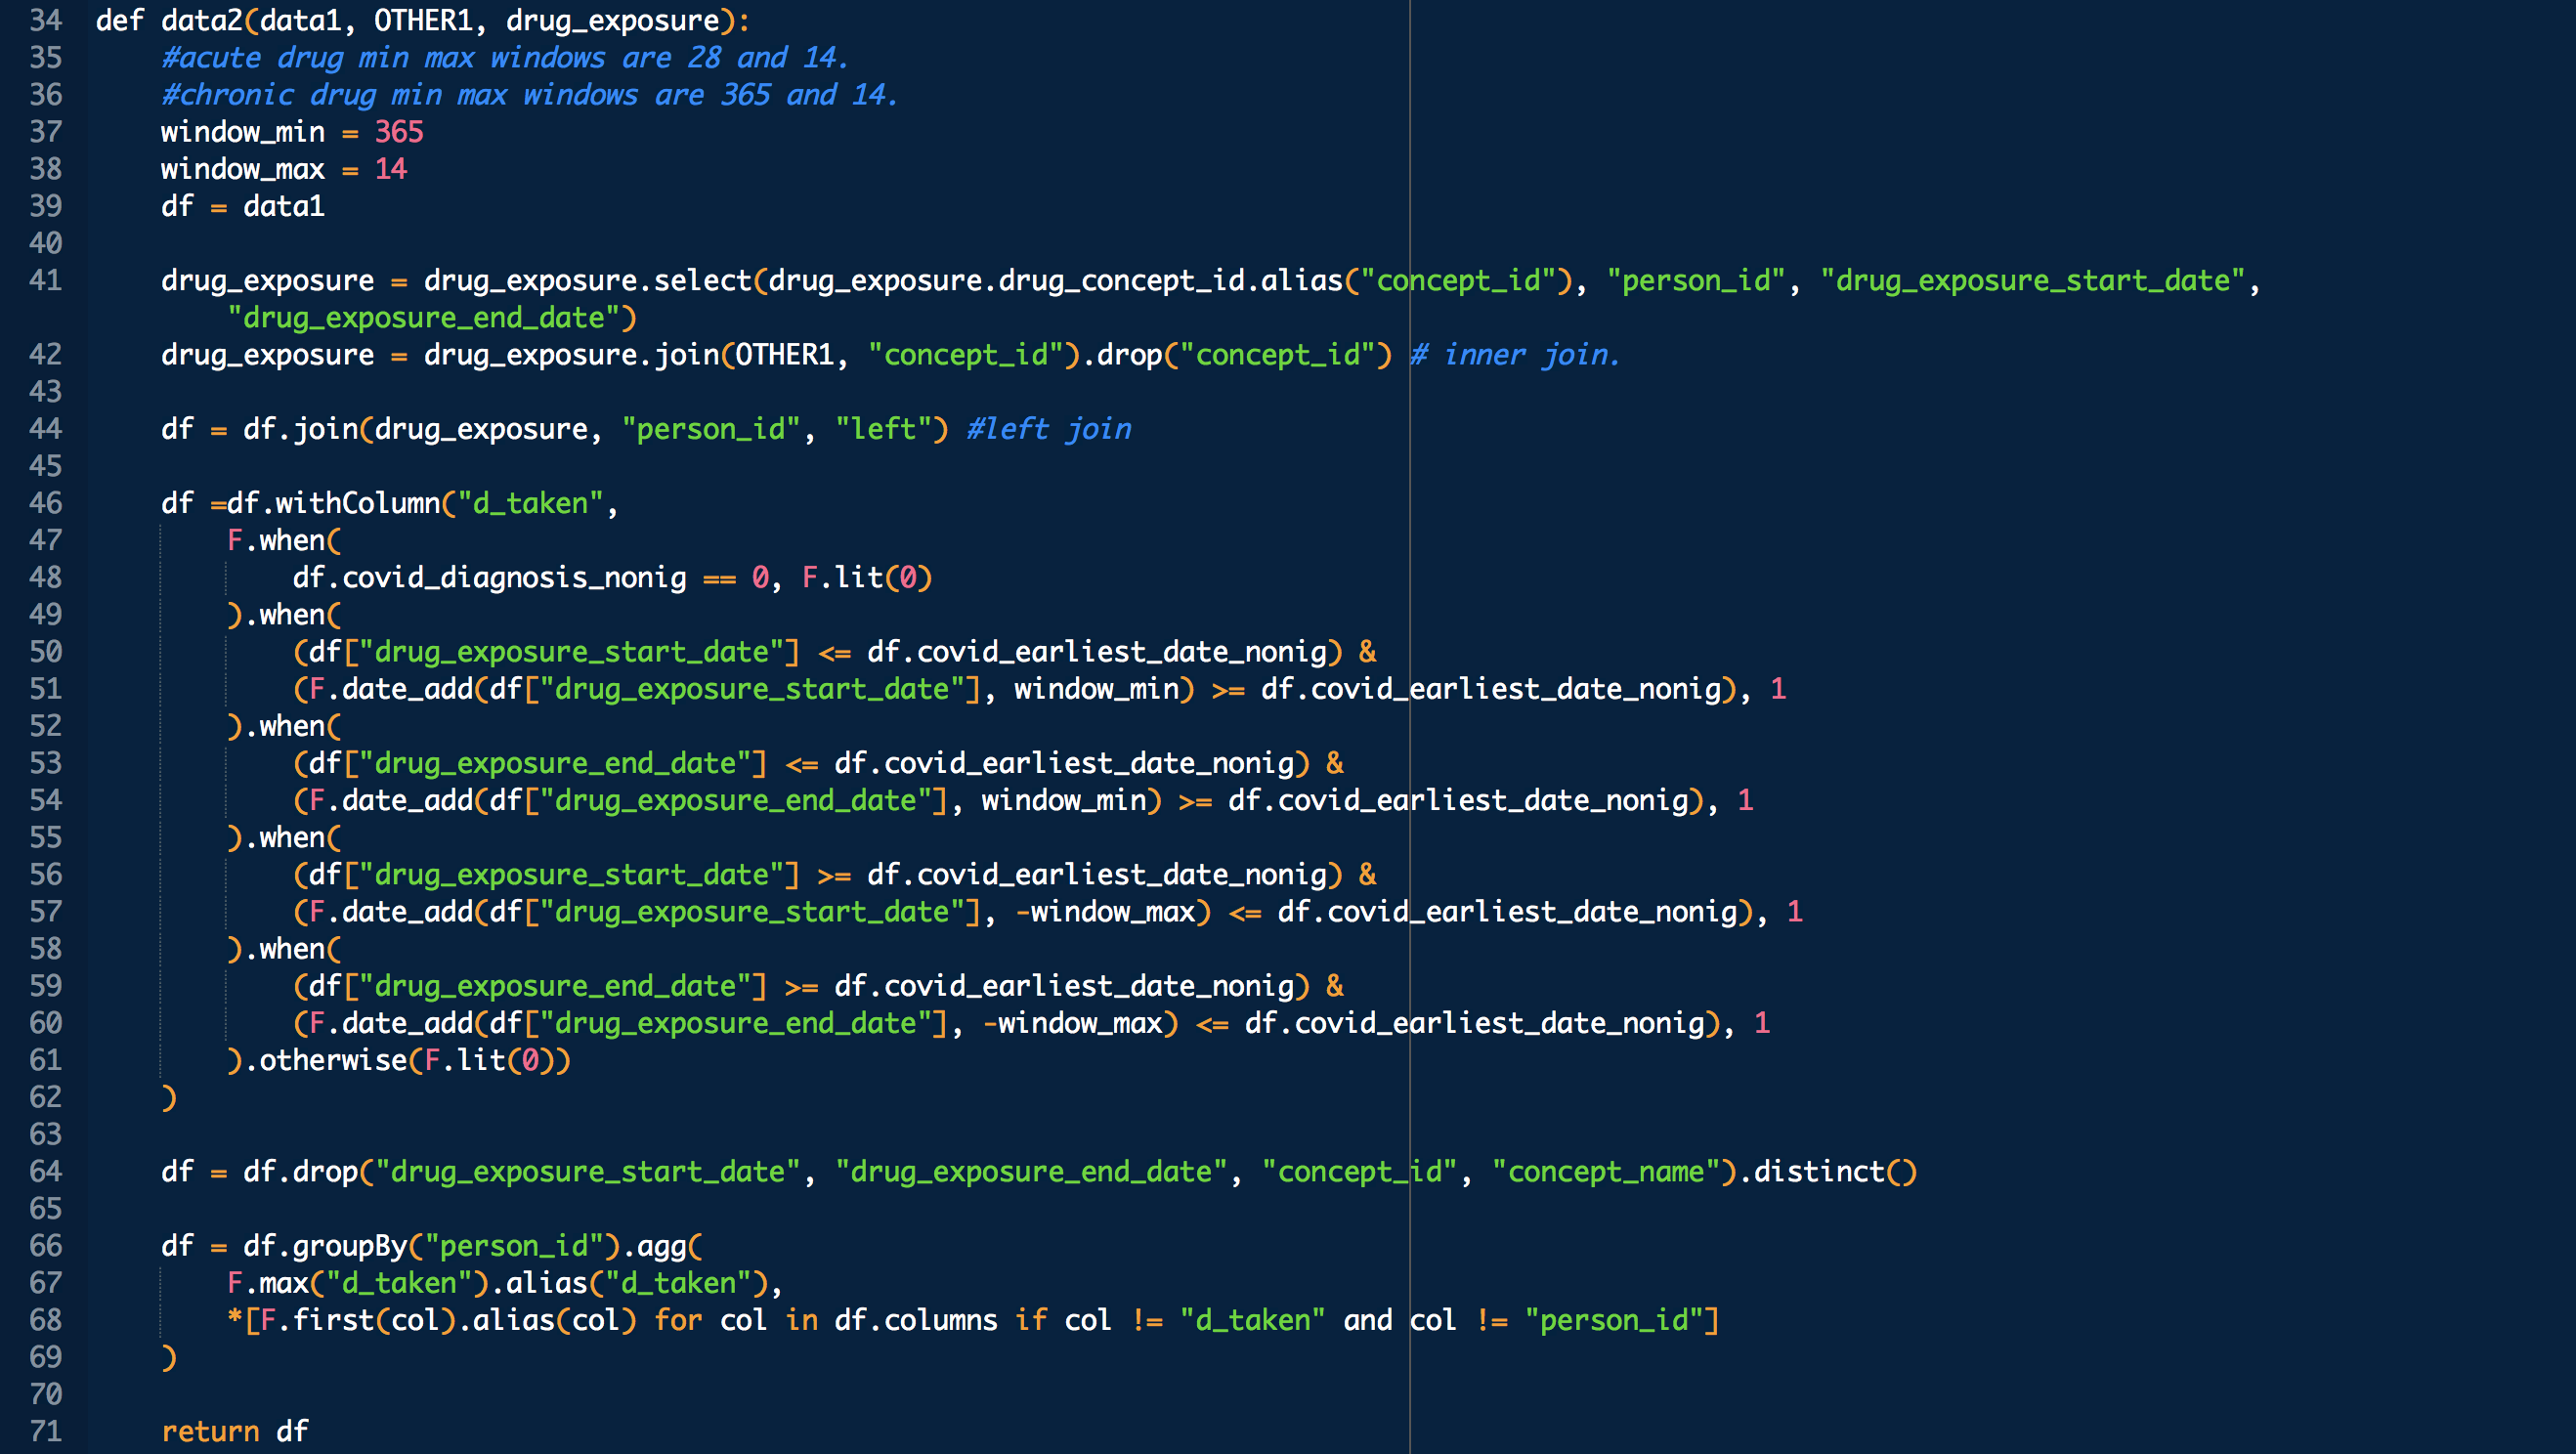
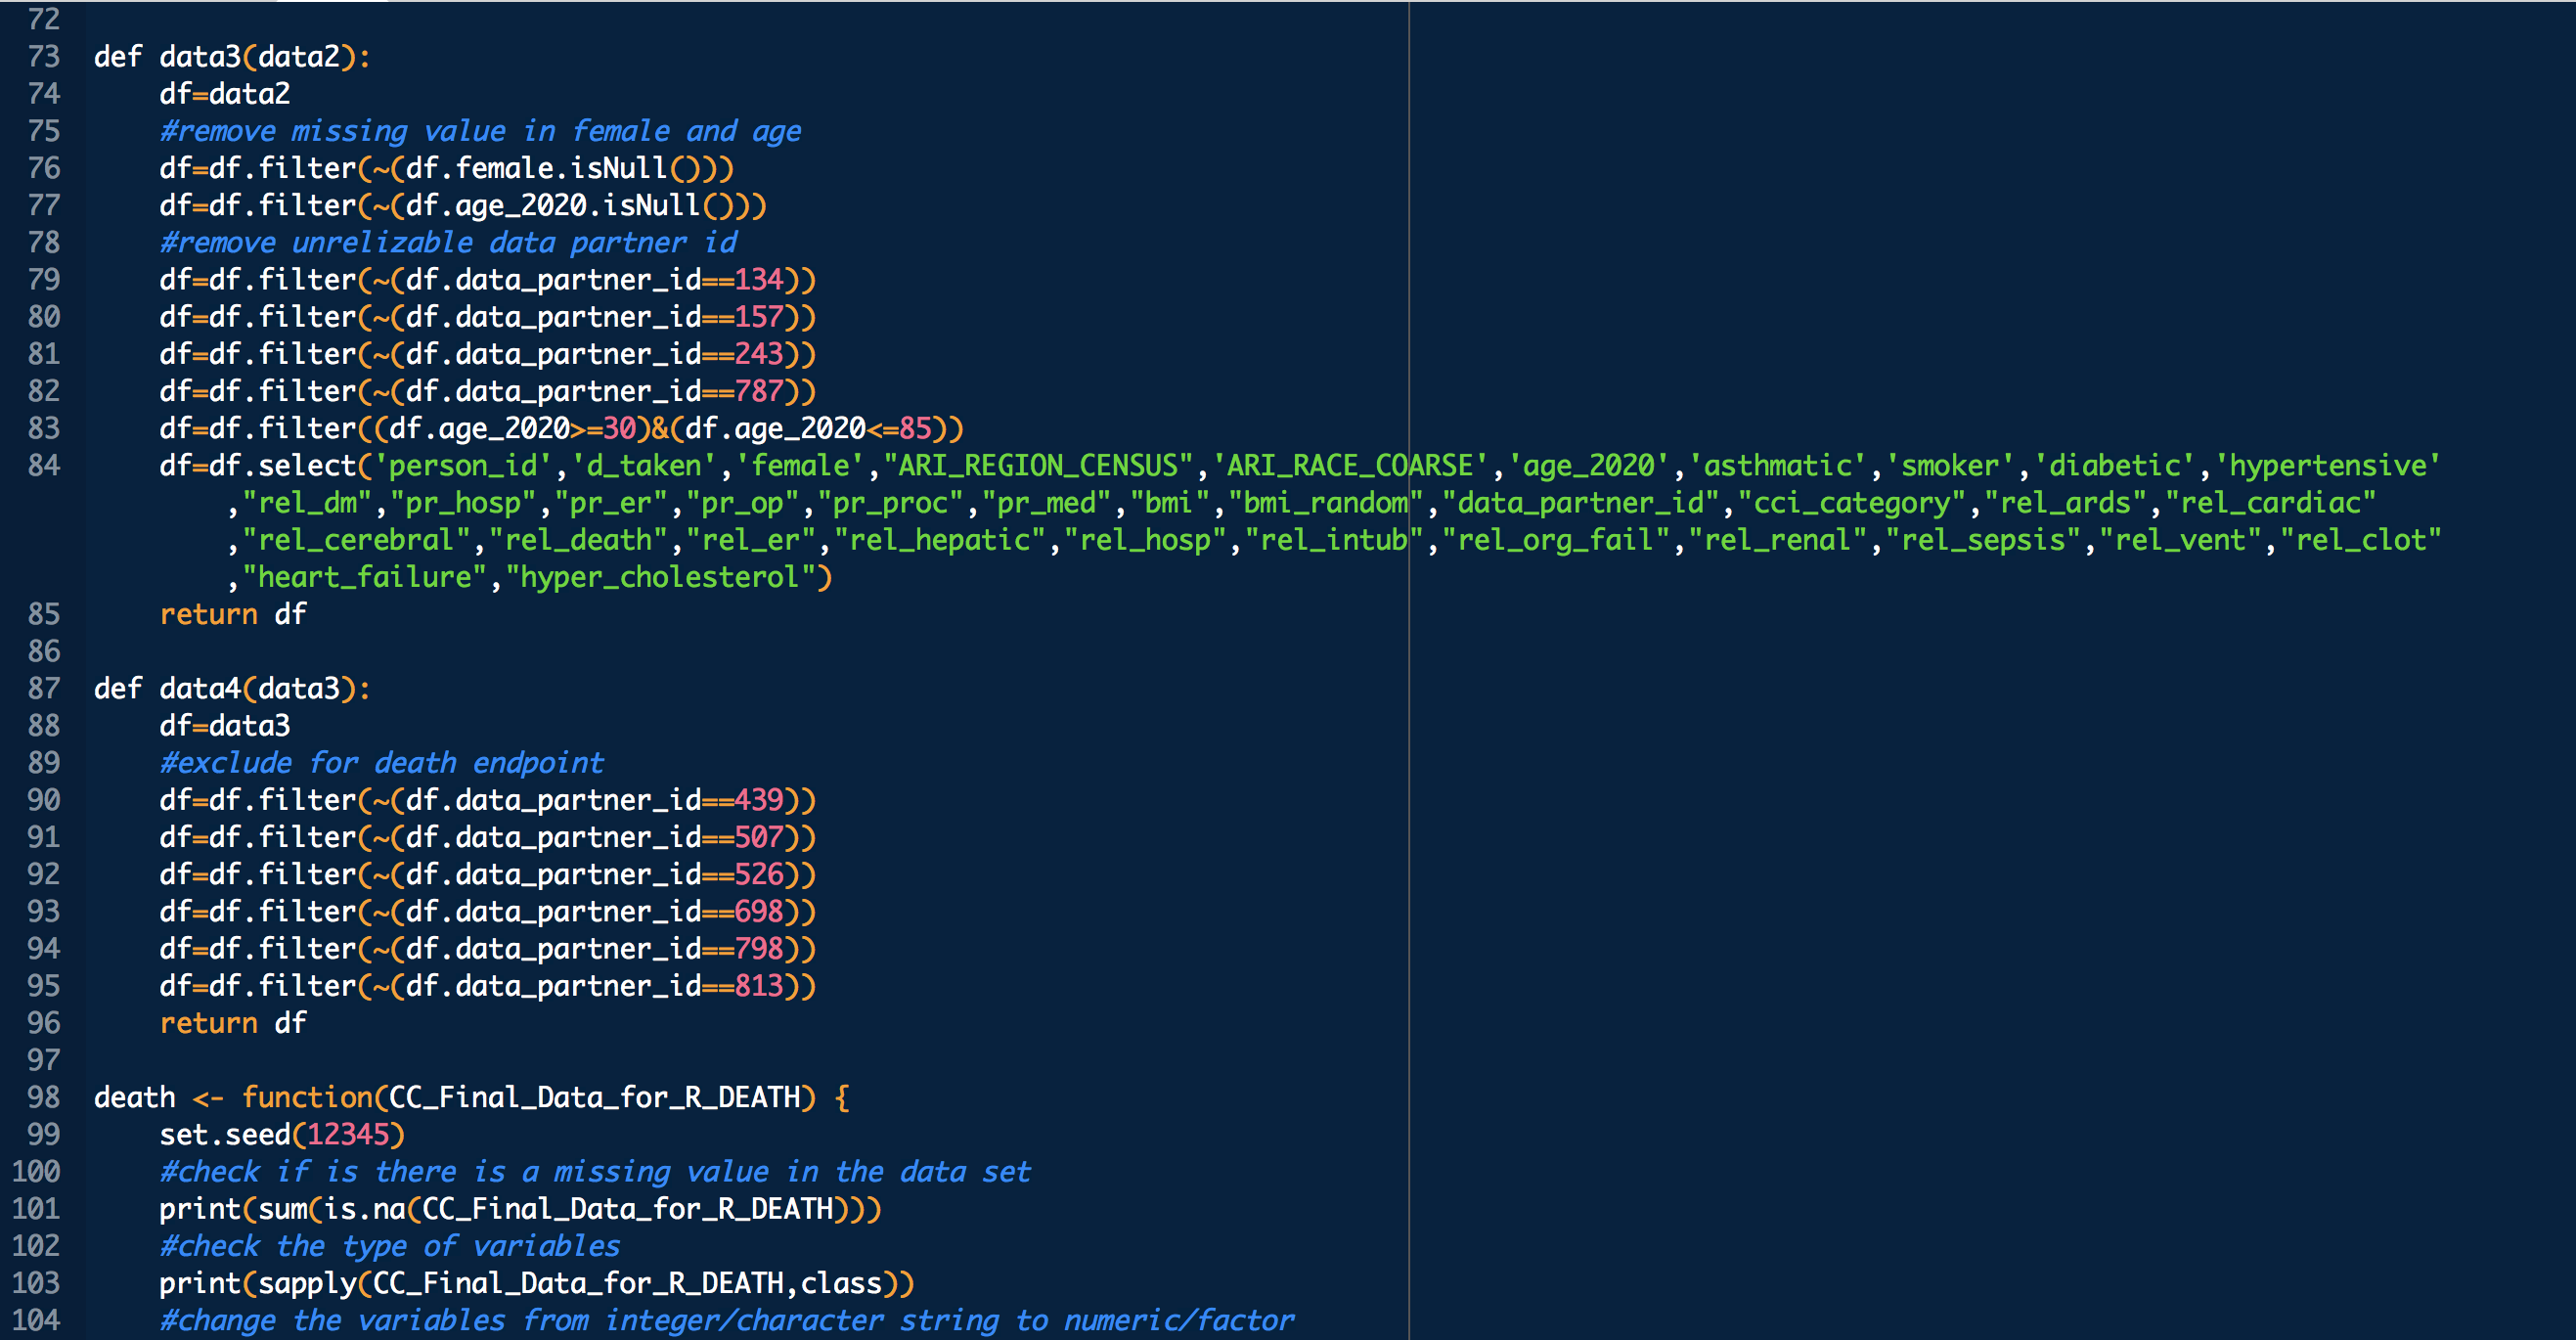
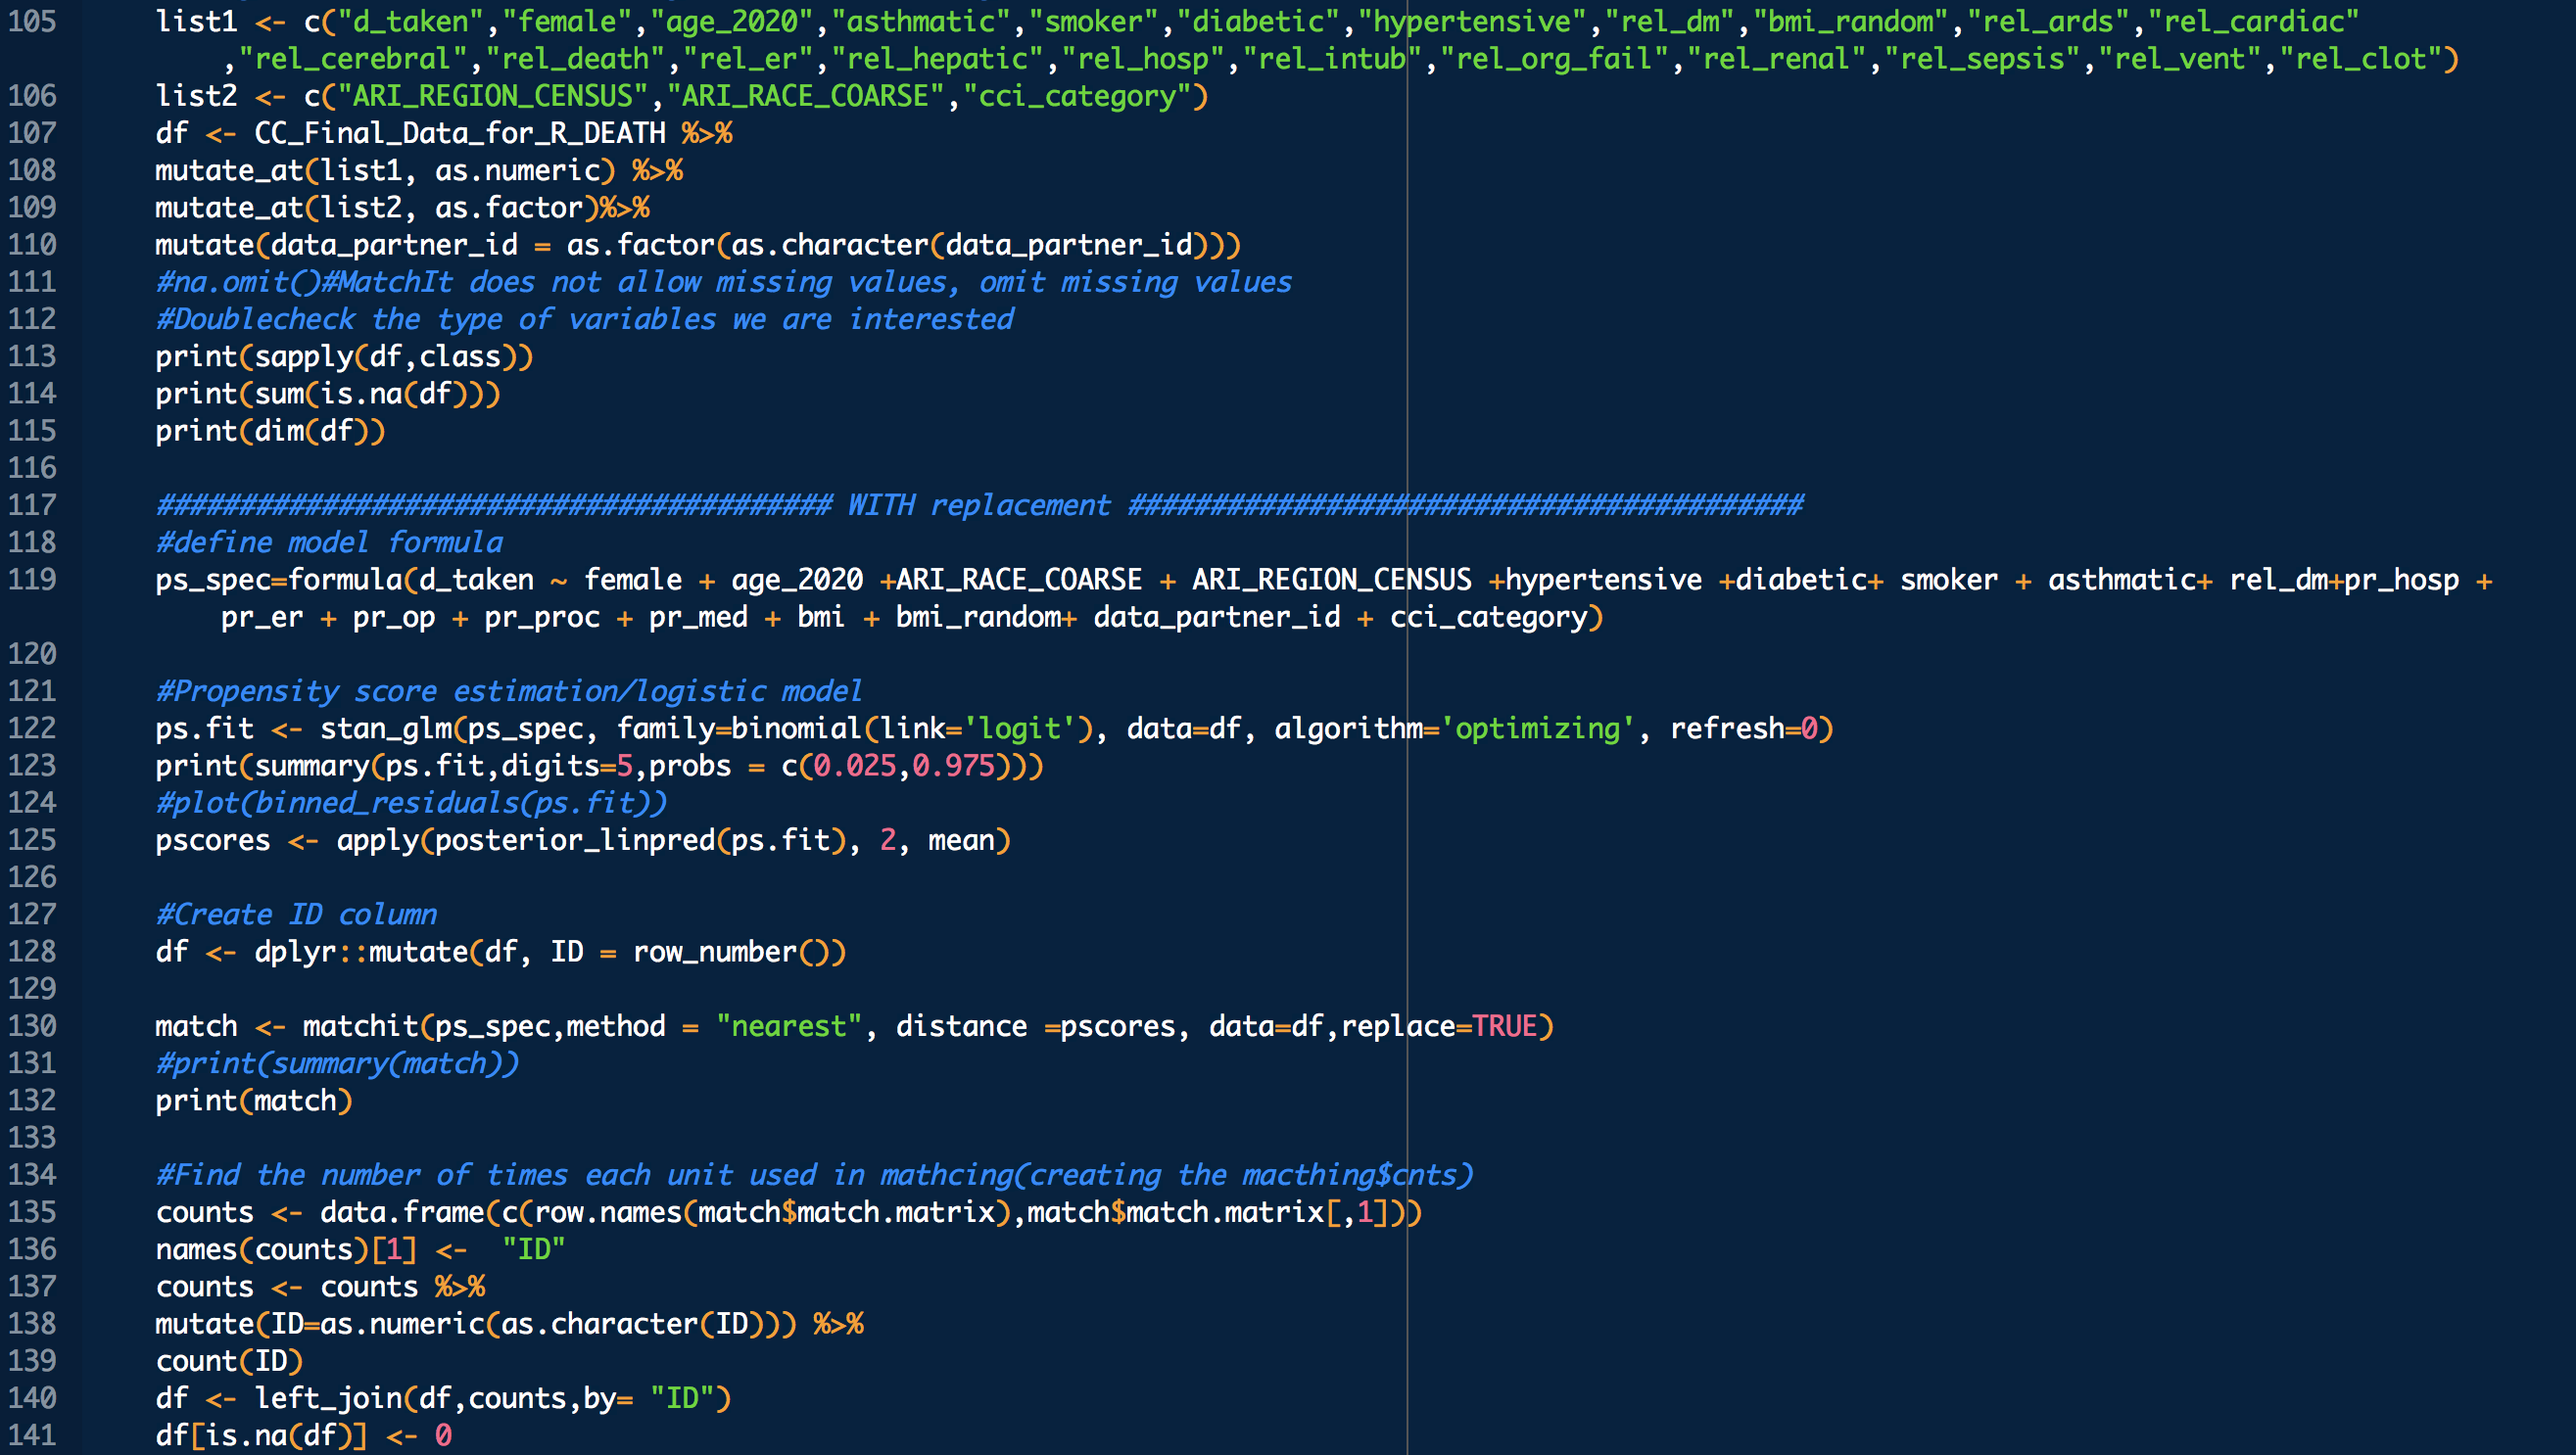
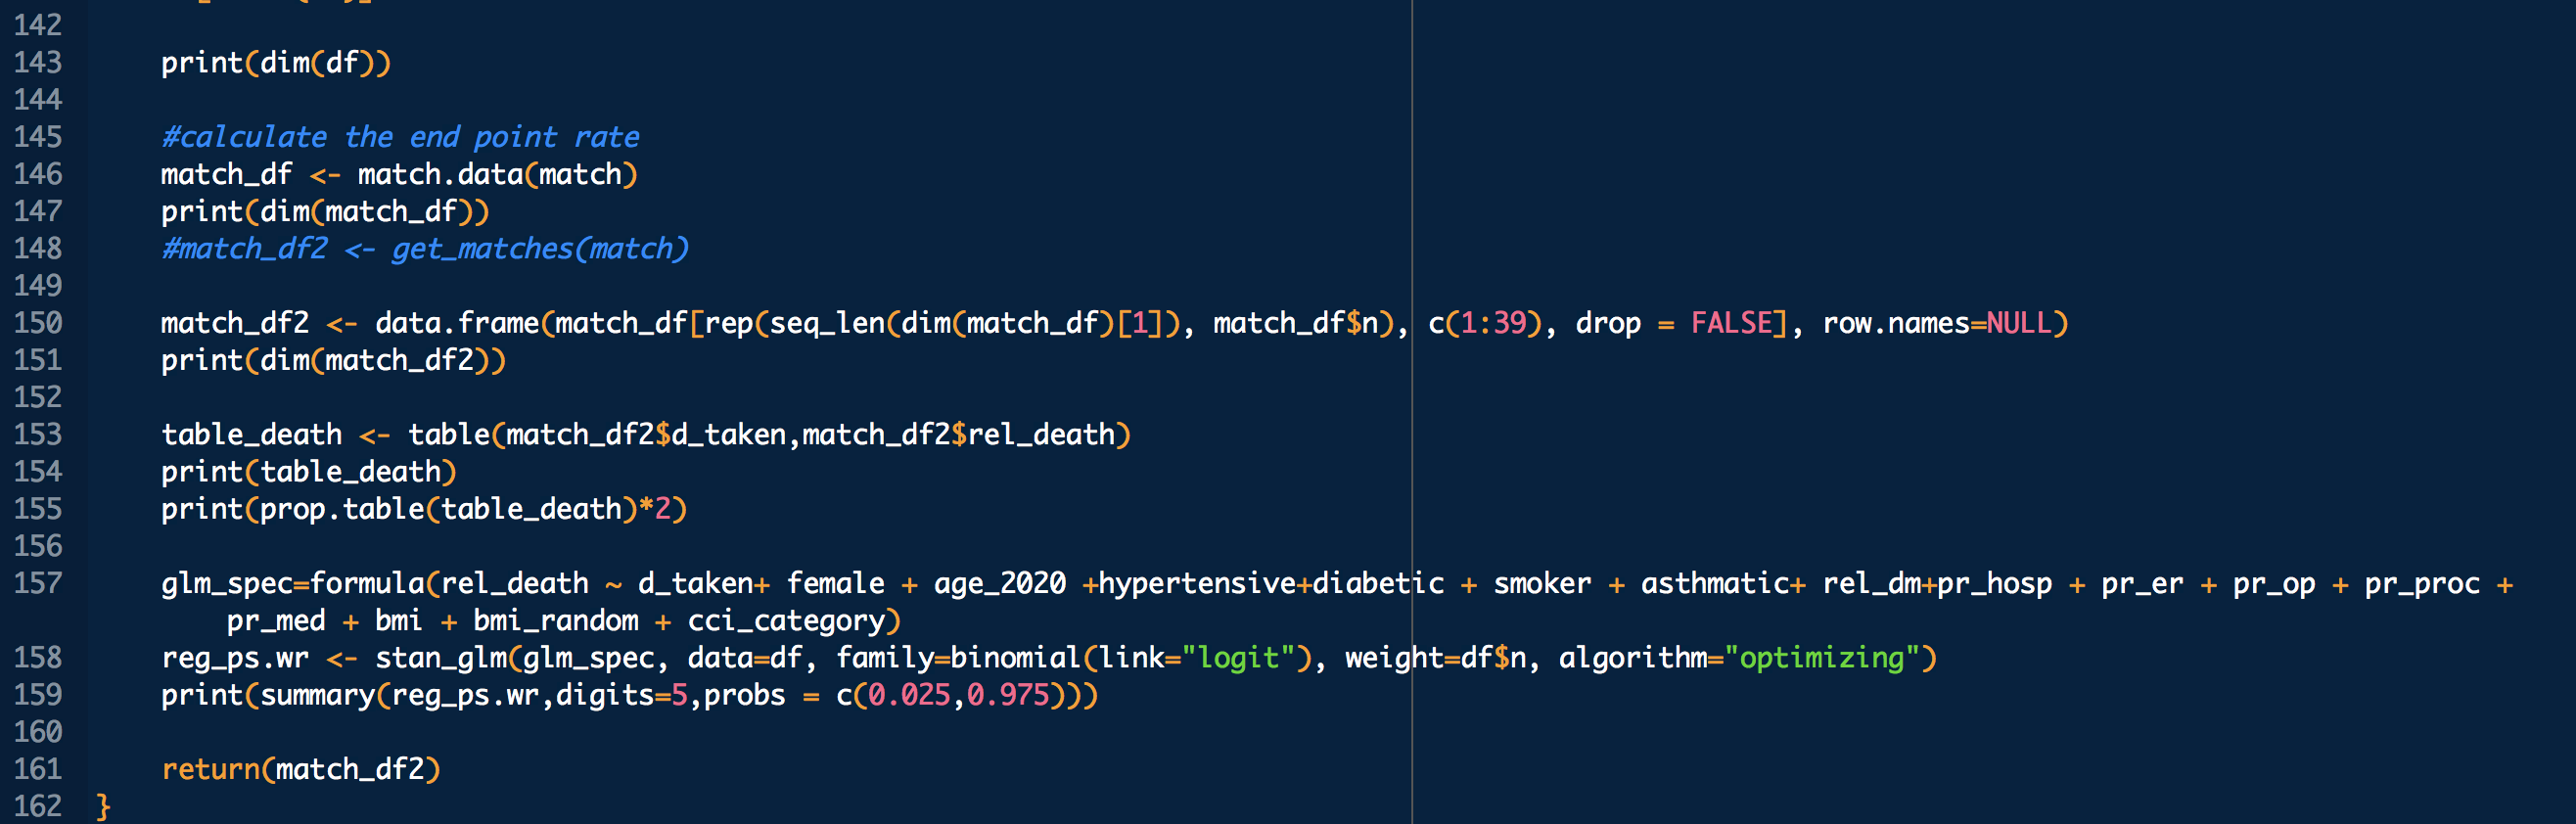
R Code used for Effect Analysis
                            
Some VARIABLE definitions:

d_taken = 1 means treated (with melatonin), 0 means untreated
female = 1 means female, otherwise male
age_2020 = age in the year 2020
asthmatic = 1 prior chronic respiratory disorder, 0 otherwise
smoker = 1,0 self explanatory
diabetic = 1 prior diabetes diagnosis, 0 otherwise
hypertensive = 1 prior hypertension diagnosis, 0 otherwise
pos_covid_diagnosis = 1 positive COVID diagnosis, 0 otherwise
ARI_REGION_CENSUS = census regions
ARI_RACE_COARSE = race
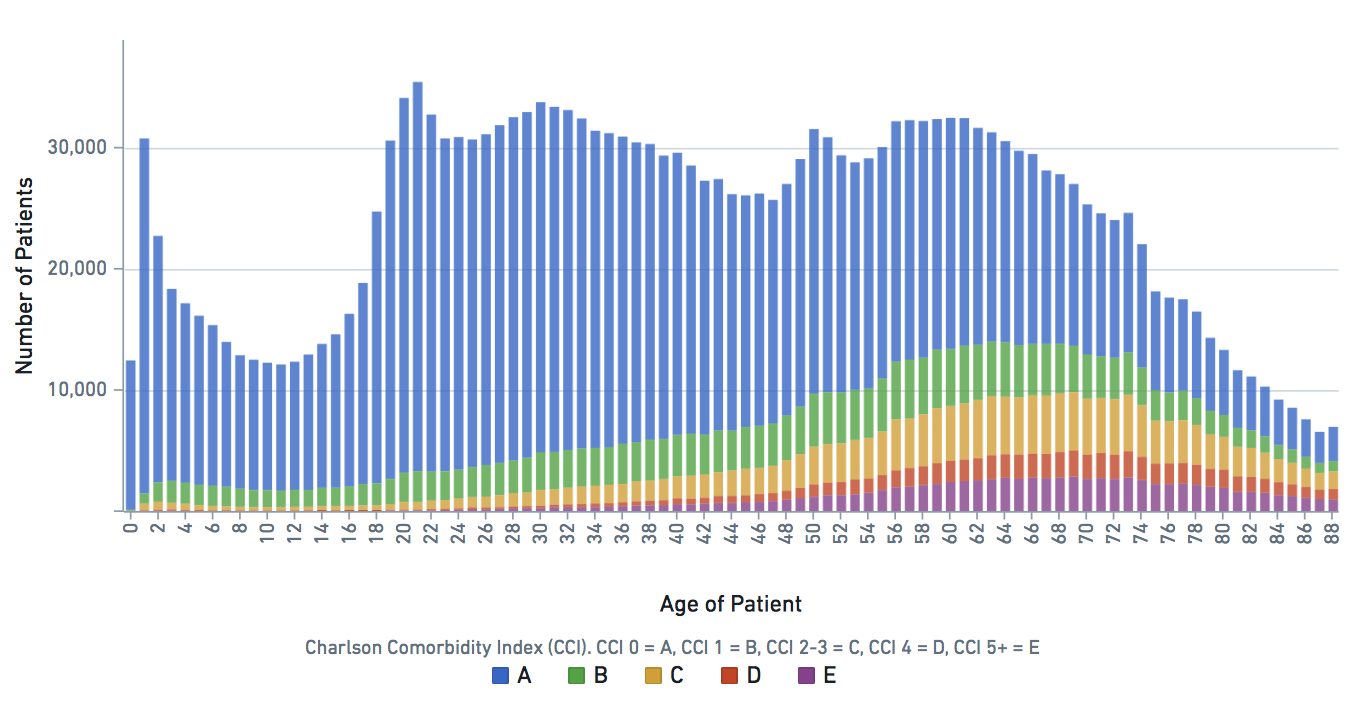
cci_category = 0->A, 1->B , 2 and 3 -> C, 4 -> D, 5+ -> E
rel_dm = covid related dexamethasone use
rel_death = death within 84 days of COVID diagnosis (minus accident driven deaths)
                            
                        
By using any of these resources ("SOFTWARE") in this site you agree that:

THE SOFTWARE IS PROVIDED "AS IS", WITHOUT WARRANTY OF ANY KIND, EXPRESS OR IMPLIED, INCLUDING BUT NOT LIMITED TO THE WARRANTIES OF MERCHANTABILITY, FITNESS FOR A PARTICULAR PURPOSE AND NONINFRINGEMENT. IN NO EVENT SHALL ALAMGIR RESEARCH INC NOR IT'S OFFICERS NOR IT'S EMPLOYEES NOR IT'S CONTRACTORS BE LIABLE FOR ANY CLAIM, DAMAGES OR OTHER LIABILITY, WHETHER IN AN ACTION OF CONTRACT, TORT OR OTHERWISE, ARISING FROM, OUT OF OR IN CONNECTION WITH THE SOFTWARE OR THE USE OR OTHER DEALINGS IN THE SOFTWARE. FURTHERMORE THE SOFTWARE IS PROVIDED ONLY FOR NON-COMMERCIAL USE. COMMERCIAL USE IS NOT PERMITTED WITHOUT EXPLICIT WRITTEN PERMISSION OF ARIScience.